Washington Metropolitan Area Transit Authority Proposed <strong>FY2017</strong> Budget Chapter 3 OPERATING EXPENSE <strong>BUDGET</strong> METROBUS MODE Approved Proposed Actual Actual Budget Budget (Dollars in Thousands) 2014 2015 2016 2017 $ Variance % Change Salaries $67,162.9 $71,054 $81,075 $114,759 $33,684 42% Full-Time Salaries $65,350 $69,507 $80,209 $120,737 $40,527 Salary Lapse $0 $0 ($2,284) ($7,896) ($5,612) Overtime Salaries $1,813 $1,546 $3,150 $1,918 ($1,232) Wages $242,180.9 $242,537 $260,150 $244,003 ($16,146) -6% Operator/StaMgr Wages $146,621 $159,768 $160,390 $151,291 ($9,099) Operator/StaMgr Overtime $30,593 $24,627 $24,350 $26,157 $1,807 Full Time Wages $59,546 $53,309 $71,127 $61,422 ($9,705) Wage Lapse $0 $0 ($2,544) ($2,296) $248 Overtime Wages $5,421 $4,833 $6,827 $7,429 $603 TOTAL SALARIES AND WAGES $309,343.8 $313,591 $341,224 $358,762 $17,538 5% Fringes $149,270.3 $162,155 $166,470 $167,300 $829 0% TOTAL PERSONNEL COST $458,614.1 $475,746 $507,695 $526,061 $18,367 4% Services $26,967.0 $28,009 $37,582 $44,620 $7,037 19% Professional & Technical $6,156 $6,991 $7,363 $11,876 $4,512 Temporary Help $95 $382 $847 $1,265 $419 Contract Maintenance $15,493 $16,715 $19,379 $19,028 ($350) Custodial Services $25 $46 $83 $85 $2 Paratransit $2 $29 $0 $0 $0 Other $5,195 $3,848 $9,911 $12,365 $2,454 Materials & Supplies $31,183.9 $29,488 $35,850 $38,496 $2,646 7% Fuel and Lubricants $3,290 $2,866 $5,043 $3,031 ($2,011) Tires $5,540 $5,695 $6,662 $5,585 ($1,077) Other $22,354 $20,927 $24,145 $29,880 $5,734 Fuel & Propulsion $30,251.0 $29,626 $29,728 $31,493 $1,766 6% Diesel Fuel $27,102 $27,046 $26,784 $26,221 ($564) Propulsion Power $0 $1,133 $0 $0 $0 Clean Natural Gas $3,149 $1,447 $2,943 $5,273 $2,329 Utilities $7,820.6 $6,641 $8,948 $15,295 $6,347 71% Electricity and Gas $5,242 $5,178 $6,488 $12,304 $5,816 Utilities - Other $2,578 $1,463 $2,460 $2,991 $531 Casualty & Liability $13,195.6 $10,855 $9,421 $13,547 $4,126 44% Insurance $6,262 $5,840 $6,752 $7,130 $377 Claims $6,933 $5,015 $2,669 $6,417 $3,748 Leases $1,204.3 $1,262 $2,250 $2,045 ($205) -9% Property $421 $380 $789 $479 ($311) Equipment $783 $882 $1,460 $1,566 $106 Miscellaneous ($230) $773 $2,841 ($14,777) ($17,618) -620% Dues And Subscriptions $121 $146 $186 $196 $10 Conferences and Meetings $36 $36 $78 $111 $33 Business Travel/Public Hrg $95 $74 $182 $122 ($60) Interview & Relocation $323 $409 $379 $681 $301 Advertising $1,209 $1,640 $1,265 $1,073 ($193) Other $175 $59 $1,069 $317 ($752) Reimbursements ($2,189) ($1,590) ($320) ($593) ($273) Capital Allocation $0 $0 $0 ($16,684) ($16,684) TOTAL NONPERSONNEL COST $110,392.4 $106,653 $126,619 $130,718 $4,099 3% TOTAL COST $569,006.4 $582,399 $634,314 $656,780 $22,466 4% III-14
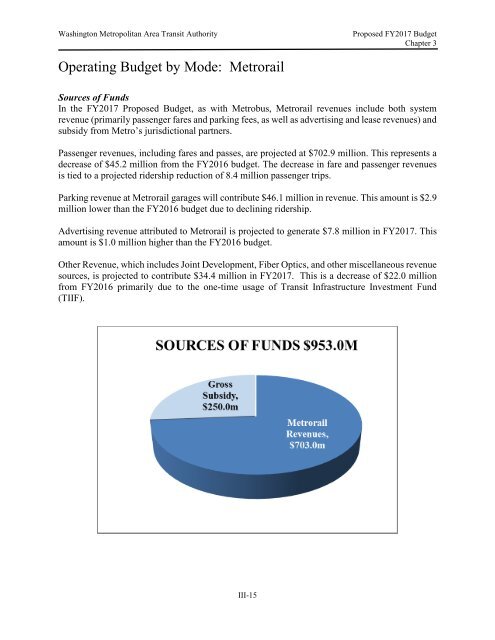
Washington Metropolitan Area Transit Authority Proposed <strong>FY2017</strong> Budget Chapter 3 Operating Budget by Mode: Metrorail Sources of Funds In the <strong>FY2017</strong> Proposed Budget, as with Metrobus, Metrorail revenues include both system revenue (primarily passenger fares and parking fees, as well as advertising and lease revenues) and subsidy from Metro’s jurisdictional partners. Passenger revenues, including fares and passes, are projected at $702.9 million. This represents a decrease of $45.2 million from the FY2016 budget. The decrease in fare and passenger revenues is tied to a projected ridership reduction of 8.4 million passenger trips. Parking revenue at Metrorail garages will contribute $46.1 million in revenue. This amount is $2.9 million lower than the FY2016 budget due to declining ridership. Advertising revenue attributed to Metrorail is projected to generate $7.8 million in <strong>FY2017</strong>. This amount is $1.0 million higher than the FY2016 budget. Other Revenue, which includes Joint Development, Fiber Optics, and other miscellaneous revenue sources, is projected to contribute $34.4 million in <strong>FY2017</strong>. This is a decrease of $22.0 million from FY2016 primarily due to the one-time usage of Transit Infrastructure Investment Fund (TIIF). III-15