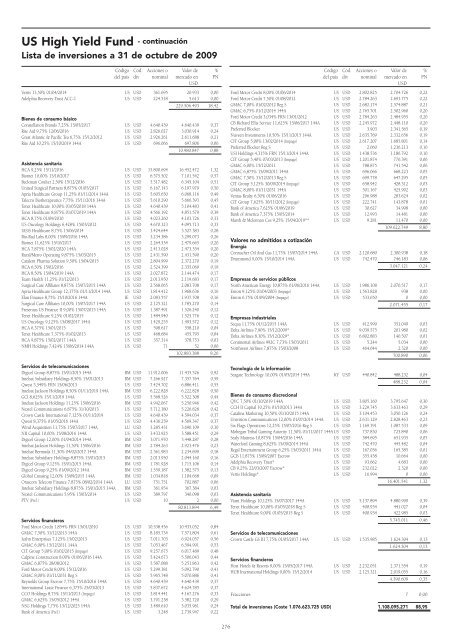
US High Yield Fund - continuación Lista de inversiones a 31 de octubre de 2009 Código Cód. Acciones o Valor de % del país div nominal mercado en PN USD Vale Capital II KY USD 28.771 2.262.760 0,18 Teck Resources 9,75% 15/05/2014 CA USD 1.958.265 2.203.048 0,18 Nova Chemicals 8,375% 01/11/2016 144A CA USD 2.162.444 2.189.475 0,18 Freeport-McMoRan C & G 3,881% FRN 01/04/2015 US USD 2.088.197 2.082.977 0,17 Huntsman Intl 5,50% 30/06/2016 144A US USD 2.194.927 1.893.125 0,15 Crown Americas 7,75% 15/11/2015 US USD 1.856.175 1.888.659 0,15 Crown Americas 7,625% 15/11/2013 US USD 1.856.175 1.884.018 0,15 Silgan Holdings 7,25% 15/08/2016 144A US USD 1.781.928 1.799.748 0,14 Nova Chemicals 8,625% 01/11/2019 144A CA USD 1.730.884 1.761.174 0,14 Terra Capital 7,75% 01/11/2019 144A US USD 1.740.165 1.740.165 0,14 Tronox Worldwide 9,50% 01/12/2012 (Impago) US USD 2.737.859 1.738.540 0,14 Berry Plastics 5,034% FRN 15/02/2015 US USD 1.856.175 1.689.120 0,14 NewPage 11,375% 31/12/2014 144A US USD 1.633.434 1.617.100 0,13 Noranda Aluminium Acquisition 5,412% 15/05/2015 US USD 2.366.942 1.594.707 0,13 Cellu Tissue Holdings 11,50% 01/06/2014 US USD 1.229.716 1.352.688 0,11 Steel Dynamics 7,375% 01/11/2012 US USD 1.262.199 1.262.199 0,10 Georgia-Pacific 8,25% 01/05/2016 144A US USD 1.183.312 1.246.915 0,10 Boise Paper Holdings 9,00% 01/11/2017 144A US USD 1.155.469 1.175.690 0,09 Headwaters 2,50% 01/02/2014 US USD 1.679.839 1.096.095 0,09 Crown Americas II 7,625% 15/05/2017 144A US USD 928.088 946.649 0,08 Verso Paper Holdings 11,50% 01/07/2014 144A US USD 737.830 774.721 0,06 Noranda Aluminium Holding 7,162% 15/11/2014 US USD 1.455.438 739.472 0,06 Silgan Holdings 6,75% 15/11/2013 US USD 742.470 735.045 0,06 Solutia 8,75% 01/11/2017 US USD 403.718 418.858 0,03 Headwaters 11,375% 01/11/2014 144A US USD 385.156 386.119 0,03 MacDermid 9,50% 15/04/2017 144A US USD 399.078 379.124 0,03 Momentive Performance Materials 10,125% 01/12/2014 US USD 103.225 80.452 0,01 Anglo American Capital 9,375% 08/04/2019 144A** GB USD 5.569 6.705 0,00 89.789.516 7,21 Empresas industriales Avis Budget Car Rental 7,75% 15/05/2016 US USD 6.496.614 5.830.711 0,47 ARAMARK 3,983% FRN 01/02/2015 US USD 6.496.614 5.684.537 0,46 Case New Holland 7,75% 01/09/2013 144A US USD 5.568.526 5.568.526 0,45 Nortek 10,00% 01/12/2013 (Impago) US USD 5.336.504 5.416.552 0,43 Navistar International 8,25% 01/11/2021 US USD 4.867.820 4.752.453 0,38 Toys R US Property I 10,75% 15/07/2017 144A US USD 3.958.294 4.265.062 0,34 Trico Shipping 11,875% 01/11/2014 144A NO USD 3.503.531 3.586.740 0,29 TransDigm 7,75% 15/07/2014 144A US USD 3.531.374 3.566.688 0,29 Sensus Metering Systems 8,625% 15/12/2013 US USD 3.382.880 3.450.537 0,28 Corrections of America 7,75% 01/06/2017 US USD 3.234.386 3.379.933 0,27 Iron Mountain 7,75% 15/01/2015 US USD 3.127.656 3.158.932 0,25 Kansas City Southern Mexico 7,625% 01/12/2013 MX USD 2.914.195 2.761.200 0,22 Avis Budget Car Rental 7,625% 15/05/2014 US USD 2.849.229 2.628.414 0,21 FTI Consulting 7,625% 15/06/2013 US USD 2.218.130 2.240.311 0,18 VWR Funding 10,25% 15/07/2015 US USD 2.477.994 2.196.897 0,18 Navios Maritime Holdings 9,50% 15/12/2014 MH USD 1.823.692 1.787.219 0,14 Continental Airlines ERJ1 9,798% 01/04/2021 US USD 2.164.002 1.693.331 0,14 Kansas City Southern Mexico 7,375% 01/06/2014 MX USD 1.392.132 1.315.564 0,11 Cenveo 10,50% 15/08/2016 144A US USD 1.271.480 1.249.229 0,10 General Cable 2,665% FRN 01/04/2015 US USD 1.392.132 1.211.154 0,10 DRS Technologies 6,625% 01/02/2016 US USD 1.150.829 1.120.598 0,09 Continental Airlines 9,25% 10/05/2017 US USD 1.018.112 1.028.293 0,08 Continental Airlines 071C 7,339% 19/04/2014 US USD 1.095.144 974.678 0,08 DigitalGlobe 10,50% 01/05/2014 144A US USD 900.245 972.265 0,08 Navios Maritime 8,875% 01/11/2017 144A MH USD 946.649 963.216 0,08 H&E Equipment Services 8,375% 15/07/2016 US USD 890.964 837.506 0,07 DRS Technologies 7,625% 01/02/2018 US USD 566.134 582.538 0,05 Delta Air Lines 9,50% 15/09/2014 144A US USD 524.370 538.790 0,04 Casella Waste Systems 11,00% 15/07/2014 144A US USD 491.886 522.629 0,04 Geo Group 7,75% 15/10/2017 144A US USD 482.606 486.225 0,04 Commercial Vehicle Group 8,00% 01/07/2013 US USD 640.381 352.209 0,03 Delta Air Lines 7,779% 02/01/2012 US USD 353.324 335.657 0,03 AMR 10,20% 15/03/2020 US USD 255.224 156.963 0,01 74.615.557 5,99 Tecnología de la información Freescale Semiconductor 9,125% 15/12/2014 US USD 16.795.113 11.839.213 0,95 First Data 9,875% 24/09/2015 US USD 9.619.629 8.946.255 0,72 Avaya 10,125% 01/11/2015 144A US USD 8.714.744 7.407.714 0,59 Ceridian 11,25% 15/11/2015 US USD 6.264.592 6.045.331 0,49 NXP Funding 7,875% 15/10/2014 NL USD 7.290.129 6.014.357 0,48 Terremark Worldwide 12,00% 15/06/2017 144A US USD 4.640.439 5.081.280 0,41 Freescale Semiconductor 8,875% 15/12/2014 US USD 5.781.987 4.712.319 0,38 Freescale Semiconductor 10,125% 15/12/2016 US USD 6.208.907 4.439.368 0,36 Sungard Data Systems 10,625% 15/05/2015 144A US USD 3.902.609 4.185.548 0,34 Sungard Data Systems 4,875% 15/01/2014 US USD 3.707.710 3.346.209 0,27 Hughes Network Systems 9,50% 15/04/2014 US USD 3.197.262 3.221.242 0,26 Spansion 11,25% 15/01/2016 144A (Impago) US USD 3.735.553 3.175.220 0,25 Freescale Semiconductor 4,174% FRN 15/12/2014 US USD 4.482.664 3.115.451 0,25 Avago Technologies Finance 10,125% 01/12/2013 SG USD 2.645.050 2.787.221 0,22 Advanced Micro Devices 6,00% 01/05/2015 144A US USD 3.712.351 2.714.842 0,22 NXP Funding 3,034% FRN 15/10/2013 NL USD 2.747.140 2.032.883 0,16 Texas Competitive Electric 10,25% 01/11/2015 US USD 2.640.410 1.861.489 0,15 Conexant Systems 4,19% FRN 15/11/2010 US USD 1.217.651 1.162.857 0,09 Viasystems 10,50% 15/01/2011 US USD 872.402 873.493 0,07 Código Cód. Acciones o Valor de % del país div nominal mercado en PN USD Avago Technologies Finance 5,861% FRN 01/06/2013 SG USD 556.853 547.804 0,04 Viasat 8,875% 15/09/2016 144A US USD 496.527 507.699 0,04 NXP Funding 10,00% 15/07/2013 144A NL USD 491.886 479.589 0,04 84.497.384 6,78 Bienes de consumo discrecional Cengage Learning 10,50% 15/01/2015 144A US USD 10.273.931 9.670.338 0,78 ServiceMaster Company 10,75% 15/07/2015 144A US USD 9.160.226 9.022.823 0,72 Scientific Games 9,25% 15/06/2019 144A US USD 8.352.790 8.478.081 0,68 Charter Communications 10,00% 30/04/2012 144A US USD 8.222.857 8.325.643 0,67 Iconix Brand Group 1,875% 30/06/2012 US USD 8.724.025 7.589.901 0,61 MGM Mirage 13,00% 15/11/2013 144A US USD 6.496.614 7.422.382 0,60 Wynn Las Vegas 7,875% 01/11/2017 144A US USD 7.276.208 7.167.065 0,58 Toys “R” Us 7,875% 15/04/2013 US USD 7.225.163 7.044.534 0,57 Nielsen Finance 10,00% 01/08/2014 US USD 6.556.940 6.819.217 0,55 CCH II Capital 10,25% 15/09/2010 (Impago) US USD 5.568.526 6.751.838 0,54 Affinion Group 11,50% 15/10/2015 US USD 6.009.368 6.249.743 0,50 Liberty Media 5,70% 15/05/2013 US USD 5.907.278 5.552.842 0,45 Six Flags Operations 12,25% 15/07/2016 144A US USD 5.925.840 5.511.031 0,44 Burlington Coat Factory 11,125% 15/04/2014 US USD 5.085.921 5.251.213 0,42 Michaels Stores 10,00% 01/11/2014 US USD 5.197.291 5.171.305 0,42 Limited Brands 8,50% 15/06/2019 144A US USD 4.640.439 4.895.663 0,39 DISH DBS 7,875% 01/09/2019 US USD 4.640.439 4.750.649 0,38 GameStop Holdings 8,00% 01/10/2012 US USD 4.524.428 4.665.816 0,37 General Nutrition Center 5,178% 15/03/2014 US USD 5.299.381 4.636.958 0,37 Penske Auto Group 3,50% 01/04/2026 US USD 4.324.889 4.400.574 0,35 Mohegan Tribal Gaming Autority 6,125% 15/02/2013 US USD 4.798.214 3.910.544 0,31 Universal City Development 11,75% 01/04/2010 US USD 3.805.160 3.809.916 0,31 Sonic Automotive 8,625% 15/08/2013 US USD 3.924.883 3.767.888 0,30 Allison Transmission 11,00% 01/11/2015 144A US USD 3.605.621 3.641.677 0,29 DISH DBS 6,625% 01/10/2014 US USD 3.712.351 3.610.261 0,29 Kabel Deutschland 10,625% 01/07/2014 DE USD 3.225.105 3.354.109 0,27 TRW Automotive 7,25% 15/03/2017 144A US USD 3.484.969 3.171.322 0,25 Wendy’s/Arby’s Restaurants 10,00% 15/07/2016 144A US USD 2.923.476 3.128.120 0,25 Harrahs Operating 11,25% 01/06/2017 144A US USD 2.886.353 2.944.080 0,24 MGM Mirage 11,125% 15/11/2017 144A US USD 2.645.050 2.909.555 0,23 Affinion Group 10,125% 15/10/2013 US USD 2.784.263 2.860.830 0,23 Levi Strauss 8,875% 01/04/2016 US USD 2.784.263 2.832.988 0,23 MGM Mirage 10,375% 15/05/2014 144A US USD 2.533.680 2.711.037 0,22 Ameristar Casinos 9,25% 01/06/2014 144A US USD 2.366.624 2.455.372 0,20 LBI Media 8,50% 01/08/2017 144A US USD 3.415.363 2.373.677 0,19 CanWest Media 8,00% 15/09/2012 CA USD 2.817.031 2.239.540 0,18 AMC Entertainment 8,75% 01/06/2019 US USD 2.171.725 2.236.877 0,18 Goodyear Tire & Rubber 5,01% FRN 01/12/2009 US USD 1.948.984 1.948.984 0,16 CCH II Capital 10,25% 15/09/2010 US USD 1.554.547 1.888.775 0,15 Charter Communications 10,375% 30/04/2014 144A US USD 1.851.535 1.888.566 0,15 DISH DBS 7,125% 01/02/2016 US USD 1.856.175 1.856.175 0,15 Seneca Gaming 7,25% 01/05/2012 US USD 1.902.580 1.835.990 0,15 DISH DBS 7,75% 31/05/2015 US USD 1.791.209 1.829.362 0,15 Staples 9,75% 15/01/2014 US USD 1.509.071 1.821.210 0,15 Rainbow National Services 10,375% 01/09/2014 144A US USD 1.662.205 1.737.004 0,14 Mac-Gray 7,625% 15/08/2015 US USD 1.698.401 1.677.171 0,13 Muzak Finance 10,00% 15/02/2009 (Impago) US USD 2.529.039 1.643.875 0,13 Nielsen Finance 11,50% 01/05/2016 US USD 1.517.423 1.631.230 0,13 CSC Holdings 8,50% 15/04/2014 144A US USD 1.526.704 1.612.581 0,13 TRW Automotive 7,00% 15/03/2014 144A US USD 1.721.603 1.601.091 0,13 Nexstar Broadcasting 7,00% 15/01/2014 US USD 2.364.622 1.584.104 0,13 Speedway Motorsports 8,75% 01/06/2016 144A US USD 1.433.896 1.498.421 0,12 Nexstar Finance Holdings 11,375% 01/04/2013 US USD 2.188.967 1.450.190 0,12 Videotron 9,125% 15/04/2018 CA USD 1.322.525 1.428.327 0,11 American Casino 11,00% 15/06/2014 144A US USD 1.535.985 1.336.307 0,11 Clear Channel Communications 5,00% 15/03/2012 US USD 2.139.242 1.176.583 0,09 Universal City Development 8,875% 15/11/2015 144A US USD 1.178.671 1.166.885 0,09 Videotron 9,125% 15/04/2018 144A CA USD 1.067.301 1.152.685 0,09 Lamar Media 6,625% 15/08/2015 C US USD 1.076.582 1.030.827 0,08 Lamar Media 9,75% 01/04/2014 US USD 928.088 1.025.537 0,08 RSC Equipment Rental 10,00% 15/07/2017 144A US USD 886.324 952.798 0,08 Interpublic Group of Cos 10,00% 15/07/2017 US USD 877.043 942.821 0,08 Sally Holdings 9,25% 15/11/2014 US USD 909.526 941.359 0,08 Station Casinos 6,00% 01/04/2012 US USD 3.828.362 909.236 0,07 Shingle Springs Tribal 9,375% 15/06/2015 144A US USD 1.280.761 883.725 0,07 Lamar Media 6,625% 15/08/2015 US USD 914.166 875.314 0,07 Affinion Group 10,125% 15/10/2013 US USD 830.639 847.251 0,07 Education Management 8,75% 01/06/2014 US USD 816.717 845.302 0,07 Nielsen Finance 11,625% 01/02/2014 US USD 788.875 844.096 0,07 Clear Channel Communications 6,25% 15/03/2011 US USD 1.248.278 836.346 0,07 Clear Channel Communications 4,40% 15/05/2011 US USD 895.605 555.275 0,04 Nexstar Finance 7,00% 15/01/2014 US USD 782.378 526.149 0,04 Claire’S Stores 9,25% 01/06/2015 US USD 672.864 518.105 0,04 Sbarro 10,375% 01/02/2015 US USD 464.044 366.595 0,03 San Pasqual Casino 8,00% 15/09/2013 144A US USD 380.516 361.490 0,03 Mdc Partners 11,00% 01/11/2016 144A CA USD 315.550 315.550 0,03 Education Management 10,25% 01/06/2016 US USD 271.002 295.392 0,02 Chukchansi Development 4,912% FRN 15/11/2012 144A US USD 371.235 222.741 0,02 Station Casinos 7,75% 15/08/2016 US USD 895.605 205.989 0,02 Reader’s Digest 9,00% 15/02/2017 (Impago) US USD 5.141.606 77.124 0,01 275
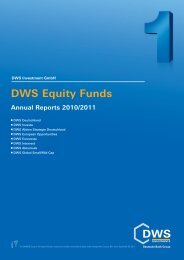
US High Yield Fund - continuación Lista de inversiones a 31 de octubre de 2009 Código Cód. Acciones o Valor de % del país div nominal mercado en PN USD Vertis 13,50% 01/04/2014 US USD 361.695 20.933 0,00 Adelphia Recovery Trust ACC-1 US USD 224.518 5.613 0,00 229.506.493 18,42 Bienes de consumo básico Constellation Brands 7,25% 15/05/2017 US USD 4.640.439 4.640.439 0,37 Rite Aid 9,75% 12/06/2016 US USD 2.826.027 3.030.914 0,24 Great Atlantic & Pacific Tea 6,75% 15/12/2012 US USD 2.926.261 2.611.688 0,21 Rite Aid 10,25% 15/10/2019 144A US USD 696.066 697.806 0,06 10.980.847 0,88 Asistencia sanitaria HCA 9,25% 15/11/2016 US USD 15.800.694 16.452.472 1,32 Biomet 10,00% 15/10/2017 US USD 6.575.502 7.101.542 0,57 Beckman Coulter 2,50% 15/12/2036 US USD 5.517.482 6.345.104 0,51 United Surgical Partners 8,875% 01/05/2017 US USD 6.167.143 6.197.979 0,50 Apria Healthcare Group 11,25% 01/11/2014 144A US USD 5.605.650 6.068.116 0,49 Talecris Biotherapeutics 7,75% 15/11/2016 144A US USD 5.610.290 5.666.393 0,45 Tenet Healthcare 10,00% 01/05/2018 144A US USD 4.640.439 5.104.483 0,41 Tenet Healthcare 8,875% 01/07/2019 144A US USD 4.566.192 4.851.579 0,39 HCA 8,75% 01/09/2010 US USD 4.023.260 4.103.726 0,33 US Oncology Holdings 6,428% 15/03/2012 US USD 4.670.323 4.095.713 0,33 IASIS Healthcare 8,75% 15/06/2014 US USD 3.424.644 3.527.383 0,28 Bio-Rad Labs 8,00% 15/09/2016 144A US USD 3.234.386 3.299.073 0,26 Biomet 11,625% 15/10/2017 US USD 2.264.534 2.479.665 0,20 HCA 7,875% 15/02/2020 144A US USD 2.413.028 2.473.354 0,20 Rural/Metro Operating 9,875% 15/03/2015 US USD 2.431.590 2.431.590 0,20 Catalent Pharma Solution 9,50% 15/04/2015 US USD 2.804.999 2.372.270 0,19 HCA 6,50% 15/02/2016 US USD 2.524.399 2.335.069 0,19 HCA 8,50% 15/04/2019 144A US USD 2.027.872 2.144.474 0,17 Team Health 11,25% 01/12/2013 US USD 2.013.950 2.119.683 0,17 Surgical Care Affiliates 8,875% 15/07/2015 144A US USD 2.568.065 2.083.708 0,17 Apria Healthcare Group 12,375% 01/11/2014 144A US USD 1.814.412 1.968.636 0,16 Elan Finance 8,75% 15/10/2016 144A IE USD 2.083.557 1.937.708 0,16 Surgical Care Affiliates 10,00% 15/07/2017 144A US USD 2.125.321 1.785.270 0,14 Fresenius US Finance II 9,00% 15/07/2015 144A US USD 1.387.491 1.526.240 0,12 Tenet Healthcare 9,25% 01/02/2015 US USD 1.484.940 1.525.776 0,12 US Oncology 9,125% 15/08/2017 144A US USD 1.429.255 1.493.572 0,12 HCA 6,375% 15/01/2015 US USD 598.617 558.210 0,04 Tenet Healthcare 7,375% 01/02/2013 US USD 468.684 455.795 0,04 HCA 9,875% 15/02/2017 144A US USD 357.314 378.753 0,03 NMH Holdings 7,424% 15/06/2014 144A US USD 71 52 0,00 102.883.388 8,26 Servicios de telecomunicaciones Digicel Group 8,875% 15/01/2015 144A BM USD 11.912.006 11.435.526 0,92 Intelsat Subsidiary Holdings 8,50% 15/01/2013 BM USD 7.266.927 7.357.764 0,59 Qwest 3,549% FRN 15/06/2013 US USD 7.424.702 6.886.411 0,55 Intelsat Jackson Holdings 8,50% 01/11/2019 144A BM USD 6.222.828 6.222.828 0,50 GCI 8,625% 15/11/2019 144A US USD 5.568.526 5.522.308 0,44 Intelsat Jackson Holdings 11,25% 15/06/2016 BM USD 4.942.067 5.250.946 0,42 Nextel Communications 6,875% 31/10/2013 US USD 5.712.380 5.226.828 0,42 Crown Castle International 7,125% 01/11/2019 US USD 4.640.439 4.594.034 0,37 Qwest 8,375% 01/05/2016 144A US USD 4.436.259 4.569.347 0,37 Wind Acquisition 11,75% 15/07/2017 144A LU USD 3.285.431 3.696.109 0,30 NII Capital 10,00% 15/08/2016 144A US USD 3.433.925 3.588.451 0,29 Digicel Group 12,00% 01/04/2014 144A BM USD 3.071.970 3.448.287 0,28 Intelsat Jackson Holdings 11,50% 15/06/2016 BM USD 2.784.263 2.923.476 0,23 Intelsat Bermuda 11,50% 04/02/2017 144A BM USD 2.361.983 2.234.699 0,18 Intelsat Subsidiary Holdings 8,875% 15/01/2015 BM USD 2.013.950 2.044.160 0,16 Digicel Group 9,125% 15/01/2015 144A BM USD 1.781.928 1.715.106 0,14 Digicel Group 9,25% 01/09/2012 144A BM USD 1.559.187 1.582.575 0,13 Global Crossing 12,00% 15/09/2015 144A BM USD 1.034.818 1.104.668 0,09 Orascom Telecom Finance 7,875% 08/02/2014 144A LU USD 751.751 702.887 0,06 Intelsat Subsidiary Holdings 8,875% 15/01/2015 144A BM USD 361.954 367.384 0,03 Nextel Communications 5,95% 15/03/2014 US USD 389.797 340.098 0,03 PTV (Pref.) US USD 10 2 0,00 80.813.894 6,49 Servicios financieros Ford Motor Credit 1,854% FRN 15/01/2010 US USD 10.538.436 10.433.052 0,84 GMAC 7,50% 31/12/2013 144A US USD 8.185.734 7.571.804 0,61 Icahn Enterprises 7,125% 15/02/2013 US USD 7.011.703 6.924.057 0,56 GMAC 6,00% 15/12/2011 144A US USD 7.053.467 6.594.991 0,53 CIT Group 5,00% 01/02/2015 (Impago) US USD 9.257.675 6.017.489 0,48 Calpine Construction 8,00% 01/06/2016 144A US USD 5.424.673 5.506.043 0,44 GMAC 6,875% 28/08/2012 US USD 5.587.088 5.251.863 0,42 Ford Motor Credit 8,00% 15/12/2016 US USD 5.299.381 5.092.790 0,41 GMAC 8,00% 01/11/2031 Reg S US USD 5.965.748 5.070.886 0,41 Reynolds Group Escrow 7,75% 15/10/2016 144A US USD 4.640.439 4.640.439 0,37 International Lease Finance 6,375% 25/03/2013 US USD 5.837.672 4.624.785 0,37 CCO Holdings 8,75% 15/11/2013 (Impago) US USD 3.814.441 4.167.276 0,33 GMAC 6,625% 15/05/2012 144A US USD 3.791.238 3.582.720 0,29 NSG Holdings 7,75% 15/12/2025 144A US USD 3.489.610 3.035.961 0,24 Bank of America (Pref.) US USD 3.248 2.739.947 0,22 Código Cód. Acciones o Valor de % del país div nominal mercado en PN USD Ford Motor Credit 8,00% 01/06/2014 US USD 2.802.825 2.704.726 0,22 Ford Motor Credit 7,50% 01/08/2012 US USD 2.784.263 2.693.775 0,22 GMAC 7,00% 01/02/2012 Reg S US USD 2.682.174 2.574.887 0,21 GMAC 6,75% 01/12/2014 144A US USD 2.765.701 2.502.960 0,20 Ford Motor Credit 3,034% FRN 13/01/2012 US USD 2.784.263 2.484.955 0,20 CB Richard Ellis Service 11,625% 15/06/2017 144A US USD 2.245.972 2.448.110 0,20 Preferred Blocker US USD 3.903 2.341.565 0,19 Nuveen Investments 10,50% 15/11/2015 144A US USD 2.635.769 2.332.656 0,19 CIT Group 5,00% 13/02/2014 (Impago) US USD 2.617.207 1.685.801 0,14 Preferred Blocker Reg S US USD 2.060 1.236.213 0,10 USI Holdings 4,315% FRN 15/11/2014 144A US USD 1.438.536 1.186.792 0,10 CIT Group 5,40% 07/03/2013 (Impago) US USD 1.201.874 776.391 0,06 GMAC 6,00% 15/12/2011 US USD 788.875 741.542 0,06 GMAC 6,875% 15/09/2011 144A US USD 696.066 668.223 0,05 GMAC 7,50% 31/12/2013 Reg S US USD 699.778 647.295 0,05 CIT Group 5,125% 30/09/2014 (Impago) US USD 658.942 428.312 0,03 GMAC 8,00% 01/11/2031 144A US USD 501.167 425.992 0,03 Ventas Realty 6,50% 01/06/2016 US USD 296.988 283.624 0,02 CIT Group 7,625% 30/11/2012 (Impago) US USD 222.741 143.878 0,01 Bank of America 7,625% 01/06/2019 US USD 30.627 34.998 0,00 Bank of America 7,375% 15/05/2014 US USD 12.993 14.481 0,00 Marsh & Mclennan Cos 9,25% 15/04/2019** US USD 9.281 11.470 0,00 109.622.749 8,80 Valores no admitidos a cotización Energía Connacher Oil And Gas 11,75% 15/07/2014 144A CA USD 2.120.680 2.300.938 0,18 Drummond 9,00% 15/10/2014 144A US USD 742.470 746.183 0,06 3.047.121 0,24 Empresas de servicios públicos North American Energy 10,875% 01/06/2016 144A US USD 1.986.108 2.070.517 0,17 Enron 9,125% 01/04/2003 (Impago) US USD 1.563.828 938 0,00 Enron 6,75% 01/09/2004 (Impago) US USD 533.650 0 0,00 2.071.455 0,17 Empresas industriales Sequa 11,75% 01/12/2015 144A US USD 412.999 351.049 0,03 Delta Airlines 7,90% 15/12/2009* US USD 9.039.575 201.980 0,02 Delta Airlines 8,30% 15/12/2029* US USD 6.802.883 140.507 0,01 Continental Airlines 992C 7,73% 15/03/2011 US USD 5.244 5.034 0,00 Northwest Airlines 7,875% 15/03/2008 US USD 464.044 2.320 0,00 700.890 0,06 Tecnología de la información Seagate Technology 10,00% 01/05/2014 144A KY USD 440.842 488.232 0,04 488.232 0,04 Bienes de consumo discrecional QVC 7,50% 01/10/2019 144A US USD 3.805.160 3.795.647 0,30 CCH II Capital 10,25% 01/10/2013 144A US USD 3.229.745 3.633.463 0,29 Catalina Marketing 10,50% 01/10/2015 144A US USD 3.104.453 3.050.126 0,24 Univision Communications 12,00% 01/07/2014 144A US USD 2.631.129 2.828.463 0,23 Six Flags Operations 12,25% 15/07/2016 Reg S US USD 1.169.391 1.087.533 0,09 Mohegan Tribal Gaming Autority 11,50% 01/11/2017 144A US USD 737.830 725.840 0,06 Sealy Mattress 10,875% 15/04/2016 144A US USD 584.695 651.935 0,05 Waterford Gaming 8,625% 15/09/2014 144A US USD 742.470 445.482 0,04 Regal Entertainment Group 6,25% 15/03/2011 144A US USD 167.056 165.385 0,01 GCB 11,875% 15/09/2007 Escrow US USD 355.458 10.664 0,00 Adelphia Recovery Trust* US USD 93.662 4.683 0,00 CB 9,25% 22/03/2007 Escrow* US USD 232.022 2.320 0,00 Vertis Holdings* US USD 16.994 0 0,00 16.401.541 1,32 Asistencia sanitaria Viant Holdings 10,125% 15/07/2017 144A US USD 5.137.894 4.880.999 0,39 Tenet Healthcare 10,00% 01/05/2018 Reg S US USD 400.934 441.027 0,04 Tenet Healthcare 9,00% 01/05/2015 Reg S US USD 400.934 422.985 0,03 5.745.011 0,46 Servicios de telecomunicaciones Crown Castle GS III 7,75% 01/05/2017 144A US USD 1.535.985 1.624.304 0,13 1.624.304 0,13 Servicios financieros Host Hotels & Resorts 9,00% 15/05/2017 144A US USD 2.232.051 2.371.554 0,19 HUB International Holdings 9,00% 15/12/2014 US USD 2.125.321 2.019.055 0,16 4.390.609 0,35 Fracciones 7 0,00 Total de inversiones (Coste 1.076.623.725 USD) 1.108.095.271 88,95 276
- Page 1 and 2:
F I D E L I T Y F U N D S SOCIÉTÉ
- Page 3 and 4:
Introducción Fidelity Funds (la
- Page 5 and 6:
Informe de Gestión* Examen de los
- Page 7 and 8:
America Fund Lista de inversiones a
- Page 9 and 10:
America Diversified Fund - continua
- Page 11 and 12:
American Growth Fund Lista de inver
- Page 13 and 14:
ASEAN Fund Lista de inversiones a 3
- Page 15 and 16:
Asia Pacific Growth & Income Fund 5
- Page 17 and 18:
Asian Aggressive Fund Lista de inve
- Page 19 and 20:
Asian Special Situations Fund - con
- Page 21 and 22:
China Focus Fund Lista de inversion
- Page 23 and 24:
Emerging Asia Fund - continuación
- Page 25 and 26:
Emerging Markets Fund Lista de inve
- Page 27 and 28:
Euro Blue Chip Fund Lista de invers
- Page 29 and 30:
European Aggressive Fund Lista de i
- Page 31 and 32:
European Dynamic Growth Fund Lista
- Page 33 and 34:
European Fund 1 - continuación Lis
- Page 35 and 36:
European Fund 1 - continuación Lis
- Page 37 and 38:
European Growth Fund - continuació
- Page 39 and 40:
European Smaller Companies Fund Lis
- Page 41 and 42:
European Smaller Companies Fund - c
- Page 43 and 44:
France Fund Lista de inversiones a
- Page 45 and 46:
Global Consumer Industries Fund Lis
- Page 47 and 48:
Global Focus Fund Lista de inversio
- Page 49 and 50:
Global Health Care Fund Lista de in
- Page 51 and 52:
Global Industrials Fund - continuac
- Page 53 and 54:
Global Real Asset Securities Fund L
- Page 55 and 56:
Global Sector Fund Lista de inversi
- Page 57 and 58:
Global Technology Fund Lista de inv
- Page 59 and 60:
Greater China Fund Lista de inversi
- Page 61 and 62:
Iberia Fund Lista de inversiones a
- Page 63 and 64:
Indonesia Fund Lista de inversiones
- Page 65 and 66:
International Fund - continuación
- Page 67 and 68:
International Fund - continuación
- Page 69 and 70:
International Fund - continuación
- Page 71 and 72:
International Fund - continuación
- Page 73 and 74:
International Fund - continuación
- Page 75 and 76:
Italy Fund Lista de inversiones a 3
- Page 77 and 78:
Japan Fund Lista de inversiones a 3
- Page 79 and 80:
Japan Smaller Companies Fund - cont
- Page 81 and 82:
Latin America Fund Lista de inversi
- Page 83 and 84:
Nordic Fund Lista de inversiones a
- Page 85 and 86:
Pacific Fund - continuación Lista
- Page 87 and 88:
South East Asia Fund Lista de inver
- Page 89 and 90:
Switzerland Fund Lista de inversion
- Page 91 and 92:
Thailand Fund Lista de inversiones
- Page 93 and 94:
World Fund Lista de inversiones a 3
- Page 95 and 96:
World Fund - continuación Lista de
- Page 97 and 98:
World Fund - continuación Lista de
- Page 99 and 100:
World Fund - continuación Lista de
- Page 101 and 102:
World Fund - continuación Lista de
- Page 103 and 104:
World Fund - continuación Lista de
- Page 105 and 106:
Fidelity Gestion Dynamique 1,4 - co
- Page 107 and 108:
Fidelity Gestion Dynamique 1,4 - co
- Page 109 and 110:
Fidelity Gestion Dynamique 1,4 - co
- Page 111 and 112:
Fidelity Gestion Dynamique 1,4 - co
- Page 113 and 114:
Fidelity Gestion Dynamique 1,4 - co
- Page 115 and 116:
Fidelity Gestion Dynamique 1,4 - co
- Page 117 and 118:
Fidelity Gestion Equilibre 1,4 - co
- Page 119 and 120:
Fidelity Gestion Equilibre 1,4 - co
- Page 121 and 122:
Fidelity Gestion Equilibre 1,4 - co
- Page 123 and 124:
Fidelity Gestion Equilibre 1,4 - co
- Page 125 and 126:
Fidelity Sélection Europe 1,4 List
- Page 127 and 128:
Fidelity Sélection Europe 1,4 - co
- Page 129 and 130:
Fidelity Sélection Europe 1,4 - co
- Page 131 and 132:
Fidelity Sélection Internationale
- Page 133 and 134:
Fidelity Sélection Internationale
- Page 135 and 136:
Fidelity Sélection Internationale
- Page 137 and 138:
Fidelity Sélection Internationale
- Page 139 and 140:
Fidelity Sélection Internationale
- Page 141 and 142:
FPS Global Growth Fund Lista de inv
- Page 143 and 144:
FPS Global Growth Fund - continuaci
- Page 145 and 146:
FPS Global Growth Fund - continuaci
- Page 147 and 148:
FPS Global Growth Fund - continuaci
- Page 149 and 150:
FPS Global Growth Fund - continuaci
- Page 151 and 152:
FPS Global Growth Fund - continuaci
- Page 153 and 154:
FPS Growth Fund - continuación Lis
- Page 155 and 156:
FPS Growth Fund - continuación Lis
- Page 157 and 158:
FPS Growth Fund - continuación Lis
- Page 159 and 160:
FPS Growth Fund - continuación Lis
- Page 161 and 162:
FPS Moderate Growth Fund Lista de i
- Page 163 and 164:
FPS Moderate Growth Fund - continua
- Page 165 and 166:
FPS Moderate Growth Fund - continua
- Page 167 and 168:
FPS Moderate Growth Fund - continua
- Page 169 and 170:
FPS Moderate Growth Fund - continua
- Page 171 and 172:
Euro Balanced Fund Lista de inversi
- Page 173 and 174:
Euro Balanced Fund - continuación
- Page 175 and 176:
Euro Balanced Fund - continuación
- Page 177 and 178:
Growth & Income Fund 1 - continuaci
- Page 179 and 180:
Growth & Income Fund 1 - continuaci
- Page 181 and 182:
Growth & Income Fund 1 - continuaci
- Page 183 and 184:
Growth & Income Fund 1 - continuaci
- Page 185 and 186:
Growth & Income Fund 1 - continuaci
- Page 187 and 188:
Growth & Income Fund 1 - continuaci
- Page 189 and 190:
Growth & Income Fund 1 - continuaci
- Page 191 and 192:
Growth & Income Fund 1 - continuaci
- Page 193 and 194:
Multi Asset Navigator Fund - contin
- Page 195 and 196:
Multi Asset Navigator Fund - contin
- Page 197 and 198:
Multi Asset Navigator Fund - contin
- Page 199 and 200:
Multi Asset Navigator Fund - contin
- Page 201 and 202:
Multi Asset Navigator Fund - contin
- Page 203 and 204:
Multi Asset Navigator Fund - contin
- Page 205 and 206:
Multi Asset Navigator Fund - contin
- Page 207 and 208:
Multi Asset Navigator Fund - contin
- Page 209 and 210:
Multi Asset Navigator Fund - contin
- Page 211 and 212:
Multi Asset Strategic Defensive Fun
- Page 213 and 214:
Multi Asset Strategic Defensive Fun
- Page 215 and 216:
Multi Asset Strategic Defensive Fun
- Page 217 and 218:
Multi Asset Strategic Defensive Fun
- Page 219 and 220:
Multi Asset Strategic Defensive Fun
- Page 221 and 222:
Multi Asset Strategic Defensive Fun
- Page 223 and 224:
Multi Asset Strategic Defensive Fun
- Page 225 and 226: Multi Asset Strategic Fund 4 Lista
- Page 227 and 228: Multi Asset Strategic Fund 4 - cont
- Page 229 and 230: Multi Asset Strategic Fund 4 - cont
- Page 231 and 232: Multi Asset Strategic Fund 4 - cont
- Page 233 and 234: Multi Asset Strategic Fund 4 - cont
- Page 235 and 236: Multi Asset Strategic Fund 4 - cont
- Page 237 and 238: Multi Asset Strategic Fund 4 - cont
- Page 239 and 240: Multi Asset Strategic Fund 4 - cont
- Page 241 and 242: Asian High Yield Fund - continuaci
- Page 243 and 244: Core Euro Bond Fund - continuación
- Page 245 and 246: Emerging Market Debt Fund 1 - conti
- Page 247 and 248: Euro Bond Fund - continuación List
- Page 249 and 250: Euro Corporate Bond Fund Lista de i
- Page 251 and 252: Euro Corporate Bond Fund - continua
- Page 253 and 254: Euro Short Term Bond Fund - continu
- Page 255 and 256: European High Yield Fund - continua
- Page 257 and 258: European High Yield Fund - continua
- Page 259 and 260: Global High Grade Income Fund 5 Lis
- Page 261 and 262: Global Inflation-linked Bond Fund -
- Page 263 and 264: International Bond Fund Lista de in
- Page 265 and 266: International Bond Fund - continuac
- Page 267 and 268: International Bond Fund II 1,4,5 Li
- Page 269 and 270: International Bond Fund II 1,4,5 -
- Page 271 and 272: Sterling Bond Fund - continuación
- Page 273 and 274: US Dollar Bond Fund Lista de invers
- Page 275: US High Yield Fund Lista de inversi
- Page 279 and 280: Euro Cash Fund 1 Lista de inversion
- Page 281 and 282: MoneyBuilder Europe Fund 1,5 Lista
- Page 283 and 284: MoneyBuilder Europe Fund 1,5 - cont
- Page 285 and 286: MoneyBuilder European Bond Fund 1,5
- Page 287 and 288: MoneyBuilder European Bond Fund 1,5
- Page 289 and 290: MoneyBuilder European Bond Fund 1,5
- Page 291 and 292: MoneyBuilder Global Fund 1,5 - cont
- Page 293 and 294: MoneyBuilder Global Fund 1,5 - cont
- Page 295 and 296: MoneyBuilder Global Fund 1,5 - cont
- Page 297 and 298: MoneyBuilder Global Fund 1,5 - cont
- Page 299 and 300: MoneyBuilder Global Fund 1,5 - cont
- Page 301 and 302: Fidelity LiveEasy Fund 1,5 Lista de
- Page 303 and 304: Fidelity LiveEasy Fund 1,5 - contin
- Page 305 and 306: Fidelity LiveEasy Fund 1,5 - contin
- Page 307 and 308: Fidelity LiveEasy Fund 1,5 - contin
- Page 309 and 310: Fidelity LiveEasy Fund 1,5 - contin
- Page 311 and 312: Fidelity LiveEasy Fund 1,5 - contin
- Page 313 and 314: Fidelity LiveEasy Fund 1,5 - contin
- Page 315 and 316: Fidelity LiveEasy Fund 1,5 - contin
- Page 317 and 318: Fidelity LiveEasy Fund 1,5 - contin
- Page 319 and 320: Fidelity LiveEasy Fund 1,5 - contin
- Page 321 and 322: Fidelity Target 2010 Fund Lista de
- Page 323 and 324: Fidelity Target 2010 Fund - continu
- Page 325 and 326: Fidelity Target 2010 Fund - continu
- Page 327 and 328:
Fidelity Target 2010 Fund - continu
- Page 329 and 330:
Fidelity Target 2010 Fund - continu
- Page 331 and 332:
Fidelity Target 2010 Fund - continu
- Page 333 and 334:
Fidelity Target 2010 Fund - continu
- Page 335 and 336:
Fidelity Target 2010 Fund - continu
- Page 337 and 338:
Fidelity Target 2010 Fund - continu
- Page 339 and 340:
Fidelity Target 2020 Fund Lista de
- Page 341 and 342:
Fidelity Target 2020 Fund - continu
- Page 343 and 344:
Fidelity Target 2020 Fund - continu
- Page 345 and 346:
Fidelity Target 2020 Fund - continu
- Page 347 and 348:
Fidelity Target 2020 Fund - continu
- Page 349 and 350:
Fidelity Target 2020 Fund - continu
- Page 351 and 352:
Fidelity Target 2020 Fund - continu
- Page 353 and 354:
Fidelity Target 2020 Fund - continu
- Page 355 and 356:
Fidelity Target 2020 Fund - continu
- Page 357 and 358:
Fidelity Target 2020 Fund - continu
- Page 359 and 360:
Fidelity Target 2010 (Euro) Fund -
- Page 361 and 362:
Fidelity Target 2010 (Euro) Fund -
- Page 363 and 364:
Fidelity Target 2010 (Euro) Fund -
- Page 365 and 366:
Fidelity Target 2010 (Euro) Fund -
- Page 367 and 368:
Fidelity Target 2010 (Euro) Fund -
- Page 369 and 370:
Fidelity Target 2015 (Euro) Fund Li
- Page 371 and 372:
Fidelity Target 2015 (Euro) Fund -
- Page 373 and 374:
Fidelity Target 2015 (Euro) Fund -
- Page 375 and 376:
Fidelity Target 2015 (Euro) Fund -
- Page 377 and 378:
Fidelity Target 2015 (Euro) Fund -
- Page 379 and 380:
Fidelity Target 2015 (Euro) Fund -
- Page 381 and 382:
Fidelity Target 2015 (Euro) Fund -
- Page 383 and 384:
Fidelity Target 2020 (Euro) Fund -
- Page 385 and 386:
Fidelity Target 2020 (Euro) Fund -
- Page 387 and 388:
Fidelity Target 2020 (Euro) Fund -
- Page 389 and 390:
Fidelity Target 2020 (Euro) Fund -
- Page 391 and 392:
Fidelity Target 2020 (Euro) Fund -
- Page 393 and 394:
Fidelity Target 2020 (Euro) Fund -
- Page 395 and 396:
Fidelity Target 2025 (Euro) Fund 4
- Page 397 and 398:
Fidelity Target 2025 (Euro) Fund 4
- Page 399 and 400:
Fidelity Target 2025 (Euro) Fund 4
- Page 401 and 402:
Fidelity Target 2025 (Euro) Fund 4
- Page 403 and 404:
Fidelity Target 2025 (Euro) Fund 4
- Page 405 and 406:
Fidelity Target 2030 (Euro) Fund 4
- Page 407 and 408:
Fidelity Target 2030 (Euro) Fund 4
- Page 409 and 410:
Fidelity Target 2030 (Euro) Fund 4
- Page 411 and 412:
Fidelity Target 2030 (Euro) Fund 4
- Page 413 and 414:
Fidelity Target 2030 (Euro) Fund 4
- Page 415 and 416:
Fidelity Target 2035 (Euro) Fund 4
- Page 417 and 418:
Fidelity Target 2035 (Euro) Fund 4
- Page 419 and 420:
Fidelity Target 2035 (Euro) Fund 4
- Page 421 and 422:
Fidelity Target 2035 (Euro) Fund 4
- Page 423 and 424:
Fidelity Target 2040 (Euro) Fund 4
- Page 425 and 426:
Fidelity Target 2040 (Euro) Fund 4
- Page 427 and 428:
Fidelity Target 2040 (Euro) Fund 4
- Page 429 and 430:
Fidelity Target 2040 (Euro) Fund 4
- Page 431 and 432:
Live 2020 Fund 1,4,5 - continuació
- Page 433 and 434:
Live 2020 Fund 1,4,5 - continuació
- Page 435 and 436:
Live 2020 Fund 1,4,5 - continuació
- Page 437 and 438:
Live 2020 Fund 1,4,5 - continuació
- Page 439 and 440:
Live 2020 Fund 1,4,5 - continuació
- Page 441 and 442:
Live 2030 Fund 1,4,5 - continuació
- Page 443 and 444:
Live 2030 Fund 1,4,5 - continuació
- Page 445 and 446:
Live 2030 Fund 1,4,5 - continuació
- Page 447 and 448:
Live 2030 Fund 1,4,5 - continuació
- Page 449 and 450:
Live 2030 Fund 1,4,5 - continuació
- Page 451 and 452:
Live Today Fund 1,4,5 - continuaci
- Page 453 and 454:
Live Today Fund 1,4,5 - continuaci
- Page 455 and 456:
Live Today Fund 1,4,5 - continuaci
- Page 457 and 458:
Live Today Fund 1,4,5 - continuaci
- Page 459 and 460:
Live Today Fund 1,4,5 - continuaci
- Page 461 and 462:
Live Today Fund 1,4,5 - continuaci
- Page 463 and 464:
FAWF America Fund 1,4,5 Lista de in
- Page 465 and 466:
FAWF American Diversified Fund 1,4,
- Page 467 and 468:
FAWF American Growth Fund 1,4,5 Lis
- Page 469 and 470:
FAWF Asian Special Situations Fund
- Page 471 and 472:
FAWF Europe Fund 1,4,5 Lista de inv
- Page 473 and 474:
FAWF International Fund 1,4,5 - con
- Page 475 and 476:
FAWF International Fund 1,4,5 - con
- Page 477 and 478:
FAWF International Fund 1,4,5 - con
- Page 479 and 480:
FAWF International Fund 1,4,5 - con
- Page 481 and 482:
FAWF International Fund 1,4,5 - con
- Page 483 and 484:
FAWF Japan Fund 1,4,5 Lista de inve
- Page 485 and 486:
FAWF Pacific Fund 1,4,5 - continuac
- Page 487 and 488:
FAWF US Dollar Bond Fund 1,4,5 List
- Page 489 and 490:
FAWF US High Income Fund 1,4,5 List
- Page 491 and 492:
FAWF US High Income Fund 1,4,5 - co
- Page 493 and 494:
FAWF Global Balanced Fund 1,4,5 Lis
- Page 495 and 496:
FAWF Global Balanced Fund 1,4,5 - c
- Page 497 and 498:
FAWF Global Balanced Fund 1,4,5 - c
- Page 499 and 500:
FAWF Global Balanced Fund 1,4,5 - c
- Page 501 and 502:
FAWF Global Balanced Fund 1,4,5 - c
- Page 503 and 504:
FAWF Global Balanced Fund 1,4,5 - c
- Page 505 and 506:
FAWF Global Balanced Fund 1,4,5 - c
- Page 507 and 508:
FAWF Global Balanced Fund 1,4,5 - c
- Page 509 and 510:
Institutional America Fund Lista de
- Page 511 and 512:
Institutional America Fund - contin
- Page 513 and 514:
Institutional Asia Pacific (ex-Japa
- Page 515 and 516:
Institutional Emerging Markets Equi
- Page 517 and 518:
Institutional Euro Blue Chip Fund L
- Page 519 and 520:
Institutional Global Focus Fund Lis
- Page 521 and 522:
Institutional Hong Kong Equity Fund
- Page 523 and 524:
Institutional Japan Fund Lista de i
- Page 525 and 526:
Institutional Pacific (ex-Japan) Fu
- Page 527 and 528:
Institutional Euro Bond Fund - cont
- Page 529 and 530:
Institutional Global Bond Fund - co
- Page 531 and 532:
Institutional Global Bond Fund - co
- Page 533 and 534:
Estado del Patrimonio Neto a 31 de
- Page 535 and 536:
Estado del Patrimonio Neto - contin
- Page 537 and 538:
Estado del Patrimonio Neto - contin
- Page 539 and 540:
Estado del Patrimonio Neto - contin
- Page 541 and 542:
Estado del Patrimonio Neto - contin
- Page 543 and 544:
Estado del Patrimonio Neto - contin
- Page 545 and 546:
Estado del Patrimonio Neto - contin
- Page 547 and 548:
Estado del Patrimonio Neto - contin
- Page 549 and 550:
Estado del Patrimonio Neto - contin
- Page 551 and 552:
Estado del Patrimonio Neto - contin
- Page 553 and 554:
Valor del Activo Neto por Acción a
- Page 555 and 556:
Valor del Activo Neto por Acción -
- Page 557 and 558:
Valor del Activo Neto por Acción -
- Page 559 and 560:
Valor del Activo Neto por Acción -
- Page 561 and 562:
Valor del Activo Neto por Acción -
- Page 563 and 564:
Valor del Activo Neto por Acción -
- Page 565 and 566:
Valor del Activo Neto por Acción -
- Page 567 and 568:
Valor del Activo Neto por Acción -
- Page 569 and 570:
Valor del Activo Neto por Acción -
- Page 571 and 572:
Valor del Activo Neto por Acción -
- Page 573 and 574:
Valor histórico del Activo Neto po
- Page 575 and 576:
Valor histórico del Activo Neto po
- Page 577 and 578:
Valor histórico del Activo Neto po
- Page 579 and 580:
Valor histórico del Activo Neto po
- Page 581 and 582:
Valor histórico del Activo Neto po
- Page 583 and 584:
Valor histórico del Activo Neto po
- Page 585 and 586:
Valor histórico del Activo Neto po
- Page 587 and 588:
Valor histórico del Activo Neto po
- Page 589 and 590:
Valor histórico del Activo Neto po
- Page 591 and 592:
Valor histórico del Activo Neto po
- Page 593 and 594:
Valor histórico del Activo Neto po
- Page 595 and 596:
Valor histórico del Activo Neto po
- Page 597 and 598:
Notas adjuntas a los Estados Financ
- Page 599 and 600:
Notas adjuntas a los Estados Financ
- Page 601 and 602:
Notas adjuntas a los Estados Financ
- Page 603 and 604:
Notas adjuntas a los Estados Financ
- Page 605 and 606:
Directorio SEDE SOCIAL Fidelity Fun