- Page 1 and 2:
F I D E L I T Y F U N D S SOCIÉTÉ
- Page 3 and 4:
Introducción Fidelity Funds (la
- Page 5 and 6:
Informe de Gestión* Examen de los
- Page 7 and 8:
America Fund Lista de inversiones a
- Page 9 and 10:
America Diversified Fund - continua
- Page 11 and 12:
American Growth Fund Lista de inver
- Page 13 and 14:
ASEAN Fund Lista de inversiones a 3
- Page 15 and 16:
Asia Pacific Growth & Income Fund 5
- Page 17 and 18:
Asian Aggressive Fund Lista de inve
- Page 19 and 20:
Asian Special Situations Fund - con
- Page 21 and 22:
China Focus Fund Lista de inversion
- Page 23 and 24:
Emerging Asia Fund - continuación
- Page 25 and 26:
Emerging Markets Fund Lista de inve
- Page 27 and 28:
Euro Blue Chip Fund Lista de invers
- Page 29 and 30:
European Aggressive Fund Lista de i
- Page 31 and 32:
European Dynamic Growth Fund Lista
- Page 33 and 34:
European Fund 1 - continuación Lis
- Page 35 and 36:
European Fund 1 - continuación Lis
- Page 37 and 38:
European Growth Fund - continuació
- Page 39 and 40:
European Smaller Companies Fund Lis
- Page 41 and 42:
European Smaller Companies Fund - c
- Page 43 and 44:
France Fund Lista de inversiones a
- Page 45 and 46:
Global Consumer Industries Fund Lis
- Page 47 and 48:
Global Focus Fund Lista de inversio
- Page 49 and 50:
Global Health Care Fund Lista de in
- Page 51 and 52:
Global Industrials Fund - continuac
- Page 53 and 54:
Global Real Asset Securities Fund L
- Page 55 and 56:
Global Sector Fund Lista de inversi
- Page 57 and 58:
Global Technology Fund Lista de inv
- Page 59 and 60:
Greater China Fund Lista de inversi
- Page 61 and 62:
Iberia Fund Lista de inversiones a
- Page 63 and 64:
Indonesia Fund Lista de inversiones
- Page 65 and 66:
International Fund - continuación
- Page 67 and 68:
International Fund - continuación
- Page 69 and 70:
International Fund - continuación
- Page 71 and 72:
International Fund - continuación
- Page 73 and 74:
International Fund - continuación
- Page 75 and 76:
Italy Fund Lista de inversiones a 3
- Page 77 and 78:
Japan Fund Lista de inversiones a 3
- Page 79 and 80:
Japan Smaller Companies Fund - cont
- Page 81 and 82:
Latin America Fund Lista de inversi
- Page 83 and 84:
Nordic Fund Lista de inversiones a
- Page 85 and 86:
Pacific Fund - continuación Lista
- Page 87 and 88:
South East Asia Fund Lista de inver
- Page 89 and 90:
Switzerland Fund Lista de inversion
- Page 91 and 92:
Thailand Fund Lista de inversiones
- Page 93 and 94:
World Fund Lista de inversiones a 3
- Page 95 and 96:
World Fund - continuación Lista de
- Page 97 and 98:
World Fund - continuación Lista de
- Page 99 and 100:
World Fund - continuación Lista de
- Page 101 and 102:
World Fund - continuación Lista de
- Page 103 and 104:
World Fund - continuación Lista de
- Page 105 and 106:
Fidelity Gestion Dynamique 1,4 - co
- Page 107 and 108:
Fidelity Gestion Dynamique 1,4 - co
- Page 109 and 110:
Fidelity Gestion Dynamique 1,4 - co
- Page 111 and 112:
Fidelity Gestion Dynamique 1,4 - co
- Page 113 and 114:
Fidelity Gestion Dynamique 1,4 - co
- Page 115 and 116:
Fidelity Gestion Dynamique 1,4 - co
- Page 117 and 118:
Fidelity Gestion Equilibre 1,4 - co
- Page 119 and 120:
Fidelity Gestion Equilibre 1,4 - co
- Page 121 and 122:
Fidelity Gestion Equilibre 1,4 - co
- Page 123 and 124:
Fidelity Gestion Equilibre 1,4 - co
- Page 125 and 126:
Fidelity Sélection Europe 1,4 List
- Page 127 and 128:
Fidelity Sélection Europe 1,4 - co
- Page 129 and 130:
Fidelity Sélection Europe 1,4 - co
- Page 131 and 132:
Fidelity Sélection Internationale
- Page 133 and 134:
Fidelity Sélection Internationale
- Page 135 and 136:
Fidelity Sélection Internationale
- Page 137 and 138:
Fidelity Sélection Internationale
- Page 139 and 140:
Fidelity Sélection Internationale
- Page 141 and 142:
FPS Global Growth Fund Lista de inv
- Page 143 and 144:
FPS Global Growth Fund - continuaci
- Page 145 and 146:
FPS Global Growth Fund - continuaci
- Page 147 and 148:
FPS Global Growth Fund - continuaci
- Page 149 and 150:
FPS Global Growth Fund - continuaci
- Page 151 and 152:
FPS Global Growth Fund - continuaci
- Page 153 and 154:
FPS Growth Fund - continuación Lis
- Page 155 and 156:
FPS Growth Fund - continuación Lis
- Page 157 and 158:
FPS Growth Fund - continuación Lis
- Page 159 and 160:
FPS Growth Fund - continuación Lis
- Page 161 and 162:
FPS Moderate Growth Fund Lista de i
- Page 163 and 164:
FPS Moderate Growth Fund - continua
- Page 165 and 166:
FPS Moderate Growth Fund - continua
- Page 167 and 168:
FPS Moderate Growth Fund - continua
- Page 169 and 170:
FPS Moderate Growth Fund - continua
- Page 171 and 172:
Euro Balanced Fund Lista de inversi
- Page 173 and 174:
Euro Balanced Fund - continuación
- Page 175 and 176:
Euro Balanced Fund - continuación
- Page 177 and 178:
Growth & Income Fund 1 - continuaci
- Page 179 and 180:
Growth & Income Fund 1 - continuaci
- Page 181 and 182:
Growth & Income Fund 1 - continuaci
- Page 183 and 184:
Growth & Income Fund 1 - continuaci
- Page 185 and 186:
Growth & Income Fund 1 - continuaci
- Page 187 and 188:
Growth & Income Fund 1 - continuaci
- Page 189 and 190:
Growth & Income Fund 1 - continuaci
- Page 191 and 192:
Growth & Income Fund 1 - continuaci
- Page 193 and 194:
Multi Asset Navigator Fund - contin
- Page 195 and 196:
Multi Asset Navigator Fund - contin
- Page 197 and 198:
Multi Asset Navigator Fund - contin
- Page 199 and 200:
Multi Asset Navigator Fund - contin
- Page 201 and 202:
Multi Asset Navigator Fund - contin
- Page 203 and 204:
Multi Asset Navigator Fund - contin
- Page 205 and 206:
Multi Asset Navigator Fund - contin
- Page 207 and 208:
Multi Asset Navigator Fund - contin
- Page 209 and 210:
Multi Asset Navigator Fund - contin
- Page 211 and 212:
Multi Asset Strategic Defensive Fun
- Page 213 and 214:
Multi Asset Strategic Defensive Fun
- Page 215 and 216:
Multi Asset Strategic Defensive Fun
- Page 217 and 218:
Multi Asset Strategic Defensive Fun
- Page 219 and 220:
Multi Asset Strategic Defensive Fun
- Page 221 and 222:
Multi Asset Strategic Defensive Fun
- Page 223 and 224:
Multi Asset Strategic Defensive Fun
- Page 225 and 226:
Multi Asset Strategic Fund 4 Lista
- Page 227 and 228:
Multi Asset Strategic Fund 4 - cont
- Page 229 and 230:
Multi Asset Strategic Fund 4 - cont
- Page 231 and 232:
Multi Asset Strategic Fund 4 - cont
- Page 233 and 234:
Multi Asset Strategic Fund 4 - cont
- Page 235 and 236:
Multi Asset Strategic Fund 4 - cont
- Page 237 and 238:
Multi Asset Strategic Fund 4 - cont
- Page 239 and 240:
Multi Asset Strategic Fund 4 - cont
- Page 241 and 242:
Asian High Yield Fund - continuaci
- Page 243 and 244:
Core Euro Bond Fund - continuación
- Page 245 and 246:
Emerging Market Debt Fund 1 - conti
- Page 247 and 248:
Euro Bond Fund - continuación List
- Page 249 and 250:
Euro Corporate Bond Fund Lista de i
- Page 251 and 252:
Euro Corporate Bond Fund - continua
- Page 253 and 254:
Euro Short Term Bond Fund - continu
- Page 255 and 256:
European High Yield Fund - continua
- Page 257 and 258:
European High Yield Fund - continua
- Page 259 and 260:
Global High Grade Income Fund 5 Lis
- Page 261 and 262:
Global Inflation-linked Bond Fund -
- Page 263 and 264:
International Bond Fund Lista de in
- Page 265 and 266:
International Bond Fund - continuac
- Page 267 and 268:
International Bond Fund II 1,4,5 Li
- Page 269 and 270:
International Bond Fund II 1,4,5 -
- Page 271 and 272:
Sterling Bond Fund - continuación
- Page 273 and 274:
US Dollar Bond Fund Lista de invers
- Page 275 and 276:
US High Yield Fund Lista de inversi
- Page 277 and 278:
US High Yield Fund - continuación
- Page 279 and 280:
Euro Cash Fund 1 Lista de inversion
- Page 281 and 282:
MoneyBuilder Europe Fund 1,5 Lista
- Page 283 and 284:
MoneyBuilder Europe Fund 1,5 - cont
- Page 285 and 286:
MoneyBuilder European Bond Fund 1,5
- Page 287 and 288:
MoneyBuilder European Bond Fund 1,5
- Page 289 and 290:
MoneyBuilder European Bond Fund 1,5
- Page 291 and 292:
MoneyBuilder Global Fund 1,5 - cont
- Page 293 and 294:
MoneyBuilder Global Fund 1,5 - cont
- Page 295 and 296:
MoneyBuilder Global Fund 1,5 - cont
- Page 297 and 298:
MoneyBuilder Global Fund 1,5 - cont
- Page 299 and 300:
MoneyBuilder Global Fund 1,5 - cont
- Page 301 and 302:
Fidelity LiveEasy Fund 1,5 Lista de
- Page 303 and 304:
Fidelity LiveEasy Fund 1,5 - contin
- Page 305 and 306:
Fidelity LiveEasy Fund 1,5 - contin
- Page 307 and 308:
Fidelity LiveEasy Fund 1,5 - contin
- Page 309 and 310:
Fidelity LiveEasy Fund 1,5 - contin
- Page 311 and 312:
Fidelity LiveEasy Fund 1,5 - contin
- Page 313 and 314:
Fidelity LiveEasy Fund 1,5 - contin
- Page 315 and 316:
Fidelity LiveEasy Fund 1,5 - contin
- Page 317 and 318:
Fidelity LiveEasy Fund 1,5 - contin
- Page 319 and 320:
Fidelity LiveEasy Fund 1,5 - contin
- Page 321 and 322:
Fidelity Target 2010 Fund Lista de
- Page 323 and 324:
Fidelity Target 2010 Fund - continu
- Page 325 and 326:
Fidelity Target 2010 Fund - continu
- Page 327 and 328:
Fidelity Target 2010 Fund - continu
- Page 329 and 330:
Fidelity Target 2010 Fund - continu
- Page 331 and 332:
Fidelity Target 2010 Fund - continu
- Page 333 and 334:
Fidelity Target 2010 Fund - continu
- Page 335 and 336:
Fidelity Target 2010 Fund - continu
- Page 337 and 338:
Fidelity Target 2010 Fund - continu
- Page 339 and 340:
Fidelity Target 2020 Fund Lista de
- Page 341 and 342:
Fidelity Target 2020 Fund - continu
- Page 343 and 344:
Fidelity Target 2020 Fund - continu
- Page 345 and 346:
Fidelity Target 2020 Fund - continu
- Page 347 and 348:
Fidelity Target 2020 Fund - continu
- Page 349 and 350:
Fidelity Target 2020 Fund - continu
- Page 351 and 352:
Fidelity Target 2020 Fund - continu
- Page 353 and 354:
Fidelity Target 2020 Fund - continu
- Page 355 and 356:
Fidelity Target 2020 Fund - continu
- Page 357 and 358:
Fidelity Target 2020 Fund - continu
- Page 359 and 360:
Fidelity Target 2010 (Euro) Fund -
- Page 361 and 362:
Fidelity Target 2010 (Euro) Fund -
- Page 363 and 364:
Fidelity Target 2010 (Euro) Fund -
- Page 365 and 366:
Fidelity Target 2010 (Euro) Fund -
- Page 367 and 368:
Fidelity Target 2010 (Euro) Fund -
- Page 369 and 370:
Fidelity Target 2015 (Euro) Fund Li
- Page 371 and 372:
Fidelity Target 2015 (Euro) Fund -
- Page 373 and 374:
Fidelity Target 2015 (Euro) Fund -
- Page 375 and 376:
Fidelity Target 2015 (Euro) Fund -
- Page 377 and 378:
Fidelity Target 2015 (Euro) Fund -
- Page 379 and 380:
Fidelity Target 2015 (Euro) Fund -
- Page 381 and 382:
Fidelity Target 2015 (Euro) Fund -
- Page 383 and 384:
Fidelity Target 2020 (Euro) Fund -
- Page 385 and 386:
Fidelity Target 2020 (Euro) Fund -
- Page 387 and 388:
Fidelity Target 2020 (Euro) Fund -
- Page 389 and 390:
Fidelity Target 2020 (Euro) Fund -
- Page 391 and 392:
Fidelity Target 2020 (Euro) Fund -
- Page 393 and 394:
Fidelity Target 2020 (Euro) Fund -
- Page 395 and 396:
Fidelity Target 2025 (Euro) Fund 4
- Page 397 and 398:
Fidelity Target 2025 (Euro) Fund 4
- Page 399 and 400:
Fidelity Target 2025 (Euro) Fund 4
- Page 401 and 402:
Fidelity Target 2025 (Euro) Fund 4
- Page 403 and 404:
Fidelity Target 2025 (Euro) Fund 4
- Page 405 and 406:
Fidelity Target 2030 (Euro) Fund 4
- Page 407 and 408:
Fidelity Target 2030 (Euro) Fund 4
- Page 409 and 410:
Fidelity Target 2030 (Euro) Fund 4
- Page 411 and 412:
Fidelity Target 2030 (Euro) Fund 4
- Page 413 and 414:
Fidelity Target 2030 (Euro) Fund 4
- Page 415 and 416:
Fidelity Target 2035 (Euro) Fund 4
- Page 417 and 418:
Fidelity Target 2035 (Euro) Fund 4
- Page 419 and 420:
Fidelity Target 2035 (Euro) Fund 4
- Page 421 and 422:
Fidelity Target 2035 (Euro) Fund 4
- Page 423 and 424:
Fidelity Target 2040 (Euro) Fund 4
- Page 425 and 426:
Fidelity Target 2040 (Euro) Fund 4
- Page 427 and 428:
Fidelity Target 2040 (Euro) Fund 4
- Page 429 and 430:
Fidelity Target 2040 (Euro) Fund 4
- Page 431 and 432:
Live 2020 Fund 1,4,5 - continuació
- Page 433 and 434: Live 2020 Fund 1,4,5 - continuació
- Page 435 and 436: Live 2020 Fund 1,4,5 - continuació
- Page 437 and 438: Live 2020 Fund 1,4,5 - continuació
- Page 439 and 440: Live 2020 Fund 1,4,5 - continuació
- Page 441 and 442: Live 2030 Fund 1,4,5 - continuació
- Page 443 and 444: Live 2030 Fund 1,4,5 - continuació
- Page 445 and 446: Live 2030 Fund 1,4,5 - continuació
- Page 447 and 448: Live 2030 Fund 1,4,5 - continuació
- Page 449 and 450: Live 2030 Fund 1,4,5 - continuació
- Page 451 and 452: Live Today Fund 1,4,5 - continuaci
- Page 453 and 454: Live Today Fund 1,4,5 - continuaci
- Page 455 and 456: Live Today Fund 1,4,5 - continuaci
- Page 457 and 458: Live Today Fund 1,4,5 - continuaci
- Page 459 and 460: Live Today Fund 1,4,5 - continuaci
- Page 461 and 462: Live Today Fund 1,4,5 - continuaci
- Page 463 and 464: FAWF America Fund 1,4,5 Lista de in
- Page 465 and 466: FAWF American Diversified Fund 1,4,
- Page 467 and 468: FAWF American Growth Fund 1,4,5 Lis
- Page 469 and 470: FAWF Asian Special Situations Fund
- Page 471 and 472: FAWF Europe Fund 1,4,5 Lista de inv
- Page 473 and 474: FAWF International Fund 1,4,5 - con
- Page 475 and 476: FAWF International Fund 1,4,5 - con
- Page 477 and 478: FAWF International Fund 1,4,5 - con
- Page 479 and 480: FAWF International Fund 1,4,5 - con
- Page 481 and 482: FAWF International Fund 1,4,5 - con
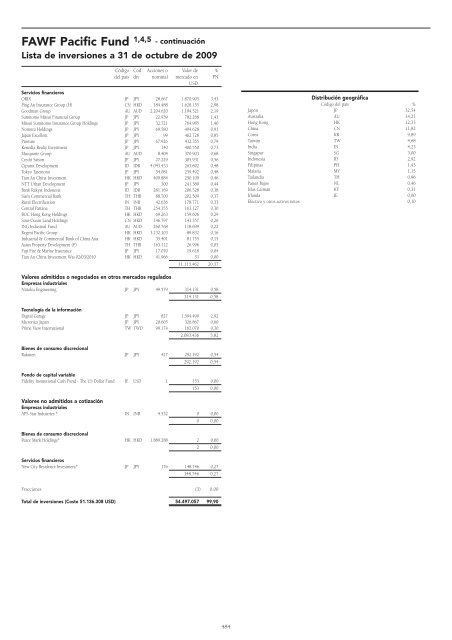
- Page 483: FAWF Japan Fund 1,4,5 Lista de inve
- Page 487 and 488: FAWF US Dollar Bond Fund 1,4,5 List
- Page 489 and 490: FAWF US High Income Fund 1,4,5 List
- Page 491 and 492: FAWF US High Income Fund 1,4,5 - co
- Page 493 and 494: FAWF Global Balanced Fund 1,4,5 Lis
- Page 495 and 496: FAWF Global Balanced Fund 1,4,5 - c
- Page 497 and 498: FAWF Global Balanced Fund 1,4,5 - c
- Page 499 and 500: FAWF Global Balanced Fund 1,4,5 - c
- Page 501 and 502: FAWF Global Balanced Fund 1,4,5 - c
- Page 503 and 504: FAWF Global Balanced Fund 1,4,5 - c
- Page 505 and 506: FAWF Global Balanced Fund 1,4,5 - c
- Page 507 and 508: FAWF Global Balanced Fund 1,4,5 - c
- Page 509 and 510: Institutional America Fund Lista de
- Page 511 and 512: Institutional America Fund - contin
- Page 513 and 514: Institutional Asia Pacific (ex-Japa
- Page 515 and 516: Institutional Emerging Markets Equi
- Page 517 and 518: Institutional Euro Blue Chip Fund L
- Page 519 and 520: Institutional Global Focus Fund Lis
- Page 521 and 522: Institutional Hong Kong Equity Fund
- Page 523 and 524: Institutional Japan Fund Lista de i
- Page 525 and 526: Institutional Pacific (ex-Japan) Fu
- Page 527 and 528: Institutional Euro Bond Fund - cont
- Page 529 and 530: Institutional Global Bond Fund - co
- Page 531 and 532: Institutional Global Bond Fund - co
- Page 533 and 534: Estado del Patrimonio Neto a 31 de
- Page 535 and 536:
Estado del Patrimonio Neto - contin
- Page 537 and 538:
Estado del Patrimonio Neto - contin
- Page 539 and 540:
Estado del Patrimonio Neto - contin
- Page 541 and 542:
Estado del Patrimonio Neto - contin
- Page 543 and 544:
Estado del Patrimonio Neto - contin
- Page 545 and 546:
Estado del Patrimonio Neto - contin
- Page 547 and 548:
Estado del Patrimonio Neto - contin
- Page 549 and 550:
Estado del Patrimonio Neto - contin
- Page 551 and 552:
Estado del Patrimonio Neto - contin
- Page 553 and 554:
Valor del Activo Neto por Acción a
- Page 555 and 556:
Valor del Activo Neto por Acción -
- Page 557 and 558:
Valor del Activo Neto por Acción -
- Page 559 and 560:
Valor del Activo Neto por Acción -
- Page 561 and 562:
Valor del Activo Neto por Acción -
- Page 563 and 564:
Valor del Activo Neto por Acción -
- Page 565 and 566:
Valor del Activo Neto por Acción -
- Page 567 and 568:
Valor del Activo Neto por Acción -
- Page 569 and 570:
Valor del Activo Neto por Acción -
- Page 571 and 572:
Valor del Activo Neto por Acción -
- Page 573 and 574:
Valor histórico del Activo Neto po
- Page 575 and 576:
Valor histórico del Activo Neto po
- Page 577 and 578:
Valor histórico del Activo Neto po
- Page 579 and 580:
Valor histórico del Activo Neto po
- Page 581 and 582:
Valor histórico del Activo Neto po
- Page 583 and 584:
Valor histórico del Activo Neto po
- Page 585 and 586:
Valor histórico del Activo Neto po
- Page 587 and 588:
Valor histórico del Activo Neto po
- Page 589 and 590:
Valor histórico del Activo Neto po
- Page 591 and 592:
Valor histórico del Activo Neto po
- Page 593 and 594:
Valor histórico del Activo Neto po
- Page 595 and 596:
Valor histórico del Activo Neto po
- Page 597 and 598:
Notas adjuntas a los Estados Financ
- Page 599 and 600:
Notas adjuntas a los Estados Financ
- Page 601 and 602:
Notas adjuntas a los Estados Financ
- Page 603 and 604:
Notas adjuntas a los Estados Financ
- Page 605 and 606:
Directorio SEDE SOCIAL Fidelity Fun