

SÃntese Anual da Agricultura de Santa Catarina - 2006-2007 - Cepa
SÃntese Anual da Agricultura de Santa Catarina - 2006-2007 - Cepa
SÃntese Anual da Agricultura de Santa Catarina - 2006-2007 - Cepa

Create successful ePaper yourself
Turn your PDF publications into a flip-book with our unique Google optimized e-Paper software.
Tomate<br />
Desempenho <strong>da</strong><br />
produção vegetal<br />
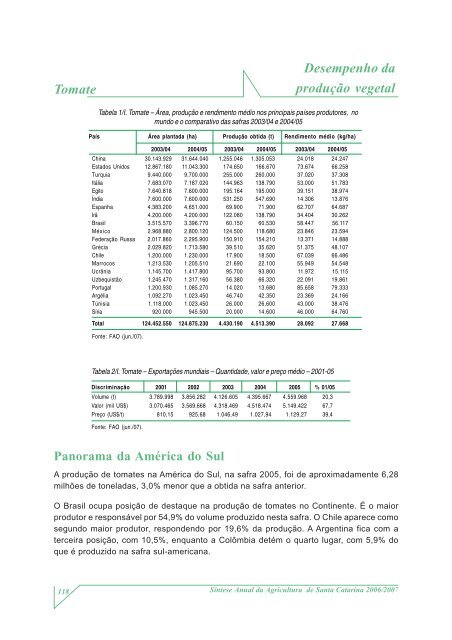
Tabela 1/I. Tomate – Área, produção e rendimento médio nos principais países produtores, no<br />
mundo e o comparativo <strong>da</strong>s safras 2003/04 e 2004/05<br />
País Área planta<strong>da</strong> (ha) Produção obti<strong>da</strong> (t) Rendimento médio (kg/ha)<br />
2003/04 2004/05 2003/04 2004/05 2003/04 2004/05<br />
China 30.143.929 31.644.040 1.255.046 1.305.053 24.018 24.247<br />
Estados Unidos 12.867.180 11.043.300 174.650 166.670 73.674 66.258<br />
Turquia 9.440.000 9.700.000 255.000 260.000 37.020 37.308<br />
Itália 7.683.070 7.187.020 144.963 138.790 53.000 51.783<br />
Egito 7.640.818 7.600.000 195.164 195.000 39.151 38.974<br />
Índia 7.600.000 7.600.000 531.250 547.690 14.306 13.876<br />
Espanha 4.383.200 4.651.000 69.900 71.900 62.707 64.687<br />
Irã 4.200.000 4.200.000 122.080 138.790 34.404 30.262<br />
Brasil 3.515.570 3.396.770 60.150 60.530 58.447 56.117<br />
México 2.968.880 2.800.120 124.500 118.680 23.846 23.594<br />
Fe<strong>de</strong>ração Russa 2.017.860 2.295.900 150.910 154.210 13.371 14.888<br />
Grécia 2.029.820 1.713.580 39.510 35.620 51.375 48.107<br />
Chile 1.200.000 1.230.000 17.900 18.500 67.039 66.486<br />
Marrocos 1.213.530 1.205.510 21.690 22.100 55.949 54.548<br />
Ucrânia 1.145.700 1.417.800 95.700 93.800 11.972 15.115<br />
Uzbequistão 1.245.470 1.317.160 56.380 66.320 22.091 19.861<br />
Portugal 1.200.930 1.085.270 14.020 13.680 85.658 79.333<br />
Argélia 1.092.270 1.023.450 46.740 42.350 23.369 24.166<br />
Túnisia 1.118.000 1.023.450 26.000 26.600 43.000 38.476<br />
Síria 920.000 945.500 20.000 14.600 46.000 64.760<br />
Total 124.452.550 124.875.230 4.430.190 4.513.390 28.092 27.668<br />
Fonte: FAO (jun./07).<br />
Tabela 2/I. Tomate – Exportações mundiais – Quanti<strong>da</strong><strong>de</strong>, valor e preço médio – 2001-05<br />
Discriminação 2001 2002 2003 2004 2005 % 01/05<br />
Volume (t) 3.789.998 3.856.282 4.126.605 4.395.667 4.559.968 20,3<br />
Valor (mil US$) 3.070.465 3.569.668 4.318.469 4.518.474 5.149.422 67,7<br />
Preço (US$/t) 810,15 925,68 1.046,49 1.027,94 1.129,27 39,4<br />
Fonte: FAO (jun./07).<br />
Panorama <strong>da</strong> América do Sul<br />
A produção <strong>de</strong> tomates na América do Sul, na safra 2005, foi <strong>de</strong> aproxima<strong>da</strong>mente 6,28<br />
milhões <strong>de</strong> tonela<strong>da</strong>s, 3,0% menor que a obti<strong>da</strong> na safra anterior.<br />
O Brasil ocupa posição <strong>de</strong> <strong>de</strong>staque na produção <strong>de</strong> tomates no Continente. É o maior<br />
produtor e responsável por 54,9% do volume produzido nesta safra. O Chile aparece como<br />
segundo maior produtor, respon<strong>de</strong>ndo por 19,6% <strong>da</strong> produção. A Argentina fica com a<br />
terceira posição, com 10,5%, enquanto a Colômbia <strong>de</strong>tém o quarto lugar, com 5,9% do<br />
que é produzido na safra sul-americana.<br />
118<br />
Síntese <strong>Anual</strong> <strong>da</strong> <strong>Agricultura</strong> <strong>de</strong> <strong>Santa</strong> <strong>Catarina</strong> <strong>2006</strong>/<strong>2007</strong>


