

SÃntese Anual da Agricultura de Santa Catarina - 2006-2007 - Cepa
SÃntese Anual da Agricultura de Santa Catarina - 2006-2007 - Cepa
SÃntese Anual da Agricultura de Santa Catarina - 2006-2007 - Cepa

Create successful ePaper yourself
Turn your PDF publications into a flip-book with our unique Google optimized e-Paper software.
Desempenho <strong>da</strong><br />
Cebola<br />
produção vegetal<br />
Por conta do aumento projetado para a cultura em nível estadual e também pela possibili<strong>da</strong><strong>de</strong><br />
<strong>de</strong> incremento <strong>da</strong> oferta nos <strong>de</strong>mais Estados <strong>da</strong> Região Sul, a nova campanha<br />
ceboleira nacional <strong>de</strong>verá revelar números em crescimento em relação aos registrados<br />
na safra anterior. Os mais recentes indicativos do IBGE projetam uma oferta bruta <strong>de</strong><br />
aproxima<strong>da</strong>mente 1.200,0 mil tonela<strong>da</strong>s do bulbo. A área a ser planta<strong>da</strong> é avalia<strong>da</strong> em 58,0<br />
mil hectares.<br />
As ativi<strong>da</strong><strong>de</strong>s culturais <strong>de</strong>sta safra já foram <strong>de</strong>finitivamente concluí<strong>da</strong>s em todos os estados<br />
sulinos. Nas <strong>de</strong>mais Uni<strong>da</strong><strong>de</strong>s produtivas <strong>da</strong> Fe<strong>de</strong>ração, a cultura apresenta-se em<br />
diversas fases, <strong>de</strong>s<strong>de</strong> o preparo do solo e plantio até as ativi<strong>da</strong><strong>de</strong>s <strong>de</strong> colheita e<br />
comercialização <strong>da</strong> produção.<br />
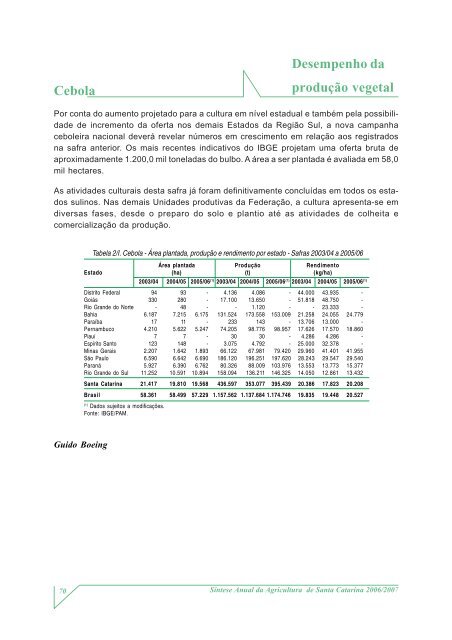
Tabela 2/I. Cebola - Área planta<strong>da</strong>, produção e rendimento por estado - Safras 2003/04 a 2005/06<br />
Área planta<strong>da</strong> Produção Rendimento<br />
Estado (ha) (t) (kg/ha)<br />
2003/04 2004/05 2005/06 (1) 2003/04 2004/05 2005/06 (1) 2003/04 2004/05 2005/06 (1)<br />
Distrito Fe<strong>de</strong>ral 94 93 - 4.136 4.086 - 44.000 43.935 -<br />
Goiás 330 280 - 17.100 13.650 - 51.818 48.750 -<br />
Rio Gran<strong>de</strong> do Norte - 48 - - 1.120 - - 23.333 -<br />
Bahia 6.187 7.215 6.175 131.524 173.558 153.009 21.258 24.055 24.779<br />
Paraíba 17 11 - 233 143 - 13.706 13.000 -<br />
Pernambuco 4.210 5.622 5.247 74.205 98.776 98.957 17.626 17.570 18.860<br />
Piauí 7 7 - 30 30 - 4.286 4.286 -<br />
Espírito Santo 123 148 - 3.075 4.792 - 25.000 32.378 -<br />
Minas Gerais 2.207 1.642 1.893 66.122 67.981 79.420 29.960 41.401 41.955<br />
São Paulo 6.590 6.642 6.690 186.120 196.251 197.620 28.243 29.547 29.540<br />
Paraná 5.927 6.390 6.762 80.326 88.009 103.976 13.553 13.773 15.377<br />
Rio Gran<strong>de</strong> do Sul 11.252 10.591 10.894 158.094 136.211 146.325 14.050 12.861 13.432<br />
<strong>Santa</strong> <strong>Catarina</strong> 21.417 19.810 19.568 436.597 353.077 395.439 20.386 17.823 20.208<br />
Brasil 58.361 58.499 57.229 1.157.562 1.137.684 1.174.746 19.835 19.448 20.527<br />
(1)<br />
Dados sujeitos a modificações.<br />
Fonte: IBGE/PAM.<br />
Guido Boeing<br />
70<br />
Síntese <strong>Anual</strong> <strong>da</strong> <strong>Agricultura</strong> <strong>de</strong> <strong>Santa</strong> <strong>Catarina</strong> <strong>2006</strong>/<strong>2007</strong>


