

SÃntese Anual da Agricultura de Santa Catarina - 2006-2007 - Cepa
SÃntese Anual da Agricultura de Santa Catarina - 2006-2007 - Cepa
SÃntese Anual da Agricultura de Santa Catarina - 2006-2007 - Cepa

You also want an ePaper? Increase the reach of your titles
YUMPU automatically turns print PDFs into web optimized ePapers that Google loves.
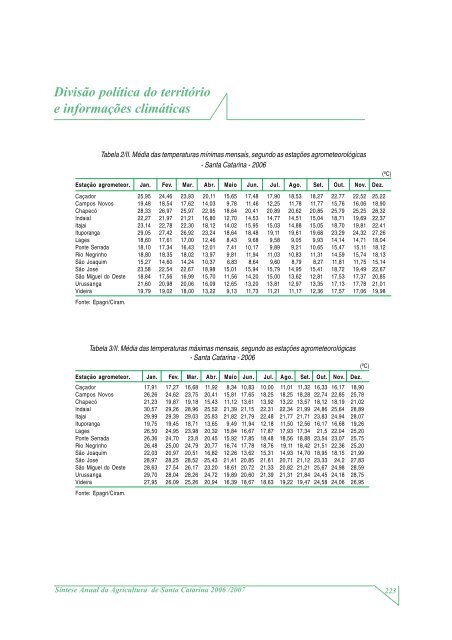
Divisão política do território<br />
e informações climáticas<br />
Tabela 2/II. Média <strong>da</strong>s temperaturas mínimas mensais, segundo as estações agrometeorológicas<br />
- <strong>Santa</strong> <strong>Catarina</strong> - <strong>2006</strong><br />
Estação agrometeor. Jan. Fev. Mar. Abr. Maio Jun. Jul. Ago. Set. Out. Nov. Dez.<br />
Caçador 25,95 24,46 23,93 20,11 15,65 17,48 17,90 18,53 18,27 22,77 22,52 25,22<br />
Campos Novos 19,48 18,54 17,62 14,03 9,78 11,46 12,25 11,78 11,77 15,76 16,06 18,90<br />
Chapecó 28,33 26,97 25,97 22,95 18,64 20,41 20,89 20,62 20,85 25,79 25,25 28,32<br />
In<strong>da</strong>ial 22,27 21,97 21,21 16,80 12,70 14,53 14,77 14,51 15,04 18,71 19,69 22,37<br />
Itajai 23,14 22,78 22,30 18,12 14,02 15,95 15,03 14,88 15,05 18,70 19,81 22,41<br />
Ituporanga 29,05 27,42 26,92 23,24 18,64 18,48 19,11 19,61 19,68 23,29 24,32 27,26<br />
Lages 18,60 17,61 17,00 12,46 8,43 9,68 9,58 9,05 9,93 14,14 14,71 18,04<br />
Ponte Serra<strong>da</strong> 18,10 17,34 16,43 12,01 7,41 10,17 9,89 9,21 10,65 15,47 15,11 18,12<br />
Rio Negrinho 18,80 18,35 18,02 13,97 9,81 11,94 11,03 10,83 11,31 14,59 15,74 18,13<br />
São Joaquim 15,27 14,60 14,24 10,37 6,83 8,64 9,60 8,79 8,27 11,81 11,75 15,14<br />
São José 23,58 22,54 22,67 18,98 15,01 15,94 15,79 14,95 15,41 18,72 19,49 22,67<br />
São Miguel do Oeste 18,84 17,56 16,99 15,70 11,56 14,20 15,00 13,62 12,81 17,53 17,37 20,85<br />
Urussanga 21,60 20,98 20,06 16,09 12,65 13,20 13,81 12,97 13,35 17,13 17,78 21,01<br />
Vi<strong>de</strong>ira 19,79 19,02 18,00 13,22 9,13 11,73 11,21 11,17 12,36 17,57 17,06 19,98<br />
Fonte: Epagri/Ciram.<br />
(ºC)<br />
Tabela 3/II. Média <strong>da</strong>s temperaturas máximas mensais, segundo as estações agrometeorológicas<br />
- <strong>Santa</strong> <strong>Catarina</strong> - <strong>2006</strong><br />
Estação agrometeor. Jan. Fev. Mar. Abr. Maio Jun. Jul. Ago. Set. Out. Nov. Dez.<br />
Caçador 17,91 17,27 16,68 11,92 8,34 10,83 10,00 11,01 11,32 16,33 16,17 18,90<br />
Campos Novos 26,26 24,62 23,75 20,41 15,81 17,65 18,25 18,25 18,28 22,74 22,85 25,78<br />
Chapecó 21,23 19,87 19,18 15,43 11,12 13,61 13,92 13,22 13,57 18,12 18,19 21,02<br />
In<strong>da</strong>ial 30,57 29,26 28,96 25,52 21,39 21,15 22,31 22,34 21,99 24,86 25,64 28,89<br />
Itajai 29,99 29,39 29,03 25,83 21,82 21,79 22,48 21,77 21,71 23,83 24,94 28,07<br />
Ituporanga 19,75 19,45 18,71 13,65 9,49 11,94 12,18 11,50 12,56 16,17 16,68 19,26<br />
Lages 26,50 24,95 23,98 20,32 15,84 16,67 17,87 17,93 17,34 21,5 22,04 25,20<br />
Ponte Serra<strong>da</strong> 26,36 24,70 23,8 20,45 15,92 17,85 18,48 18,56 18,88 23,54 23,07 25,75<br />
Rio Negrinho 26,48 25,00 24,79 20,77 16,74 17,78 18,76 19,11 18,42 21,51 22,36 25,20<br />
São Joaquim 22,03 20,97 20,51 16,82 12,26 13,62 15,31 14,93 14,70 18,95 18,15 21,99<br />
São José 28,97 28,25 28,52 25,43 21,41 20,85 21,61 20,71 21,12 23,33 24,2 27,83<br />
São Miguel do Oeste 28,63 27,54 26,17 23,20 18,61 20,72 21,33 20,82 21,21 25,67 24,98 28,59<br />
Urussanga 29,70 28,04 28,26 24,72 19,89 20,60 21,39 21,31 21,84 24,45 24,18 28,75<br />
Vi<strong>de</strong>ira 27,95 26,09 25,26 20,94 16,39 18,67 18,63 19,22 19,47 24,58 24,06 26,95<br />
Fonte: Epagri/Ciram.<br />
(ºC)<br />
Síntese <strong>Anual</strong> <strong>da</strong> <strong>Agricultura</strong> <strong>de</strong> <strong>Santa</strong> <strong>Catarina</strong> <strong>2006</strong> /<strong>2007</strong> 223


