

SÃntese Anual da Agricultura de Santa Catarina - 2006-2007 - Cepa
SÃntese Anual da Agricultura de Santa Catarina - 2006-2007 - Cepa
SÃntese Anual da Agricultura de Santa Catarina - 2006-2007 - Cepa

Create successful ePaper yourself
Turn your PDF publications into a flip-book with our unique Google optimized e-Paper software.
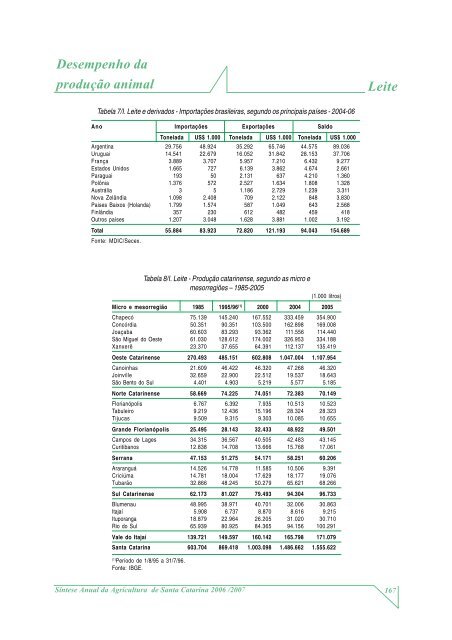
Desempenho <strong>da</strong><br />
produção animal<br />
Leite<br />
Tabela 7/I. Leite e <strong>de</strong>rivados - Importações brasileiras, segundo os principais países - 2004-06<br />
Ano Importações Exportações Saldo<br />
Tonela<strong>da</strong> US$ 1.000 Tonela<strong>da</strong> US$ 1.000 Tonela<strong>da</strong> US$ 1.000<br />
Argentina 29.756 48.924 35.292 65.746 44.575 89.036<br />
Uruguai 14.541 22.679 16.052 31.842 28.153 37.706<br />
França 3.889 3.707 5.957 7.210 6.432 9.277<br />
Estados Unidos 1.665 727 6.139 3.862 4.674 2.661<br />
Paraguai 193 50 2.131 637 4.210 1.360<br />
Polônia 1.376 572 2.527 1.634 1.808 1.328<br />
Austrália 3 5 1.186 2.729 1.239 3.311<br />
Nova Zelândia 1.098 2.408 709 2.122 848 3.830<br />
Paises Baixos (Holan<strong>da</strong>) 1.799 1.574 587 1.049 643 2.568<br />
Finlândia 357 230 612 482 459 418<br />
Outros países 1.207 3.048 1.628 3.881 1.002 3.192<br />
Total 55.884 83.923 72.820 121.193 94.043 154.689<br />
Fonte: MDIC/Secex.<br />
Tabela 8/I. Leite - Produção catarinense, segundo as micro e<br />
mesorregiões – 1985-2005<br />
(1.000 litros)<br />
Micro e mesorregião 1985 1995/96 (1) 2000 2004 2005<br />
Chapecó 75.139 145.240 167.552 333.459 354.900<br />
Concórdia 50.351 90.351 103.500 162.898 169.008<br />
Joaçaba 60.603 83.293 93.362 111.556 114.440<br />
São Miguel do Oeste 61.030 128.612 174.002 326.953 334.188<br />
Xanxerê 23.370 37.655 64.391 112.137 135.419<br />
Oeste Catarinense 270.493 485.151 602.808 1.047.004 1.107.954<br />
Canoinhas 21.609 46.422 46.320 47.268 46.320<br />
Joinville 32.659 22.900 22.512 19.537 18.643<br />
São Bento do Sul 4.401 4.903 5.219 5.577 5.185<br />
Norte Catarinense 58.669 74.225 74.051 72.383 70.149<br />
Florianópolis 6.767 6.392 7.935 10.513 10.523<br />
Tabuleiro 9.219 12.436 15.196 28.324 28.323<br />
Tijucas 9.509 9.315 9.303 10.085 10.655<br />
Gran<strong>de</strong> Florianópolis 25.495 28.143 32.433 48.922 49.501<br />
Campos <strong>de</strong> Lages 34.315 36.567 40.505 42.483 43.145<br />
Curitibanos 12.838 14.708 13.666 15.768 17.061<br />
Serrana 47.153 51.275 54.171 58.251 60.206<br />
Araranguá 14.526 14.778 11.585 10.506 9.391<br />
Criciúma 14.781 18.004 17.629 18.177 19.076<br />
Tubarão 32.866 48.245 50.279 65.621 68.266<br />
Sul Catarinense 62.173 81.027 79.493 94.304 96.733<br />
Blumenau 48.995 38.971 40.701 32.006 30.863<br />
Itajaí 5.908 6.737 8.870 8.616 9.215<br />
Ituporanga 18.879 22.964 26.205 31.020 30.710<br />
Rio do Sul 65.939 80.925 84.365 94.156 100.291<br />
Vale do Itajaí 139.721 149.597 160.142 165.798 171.079<br />
<strong>Santa</strong> <strong>Catarina</strong> 603.704 869.418 1.003.098 1.486.662 1.555.622<br />
(1)<br />
Período <strong>de</strong> 1/8/95 a 31/7/96.<br />
Fonte: IBGE.<br />
Síntese <strong>Anual</strong> <strong>da</strong> <strong>Agricultura</strong> <strong>de</strong> <strong>Santa</strong> <strong>Catarina</strong> <strong>2006</strong> /<strong>2007</strong><br />
167


