Feijão Desempenho <strong>da</strong> produção vegetal Tabela 3/I. Feijão - Área, produção e rendimento médio mundial - 2003-05 País Área (mil ha) Produção (mil t) Rendimento (kg/ha) 2003 2004 2005 2003 2004 2005 2003 2004 2005 Brasil 5.889,87 7.925,81 5.194,70 3.302,40 2.967,01 3.021,50 560,70 374,30 581,70 India 6.565,68 7.003,39 8.000,45 2.340,90 3.171,00 2.660,00 356,50 452,80 332,50 Myanmar 1.751,66 2.588,28 1.681,18 1.661,00 1.680,00 1.680,00 948,20 649,10 999,30 China 1.211,74 828,29 1.841,29 2.079,80 1.758,49 1.610,50 1.716,40 2.123,00 874,70 E. Unidos 551,34 503,29 642,34 1.029,15 820,05 1.248,70 1.866,60 1.629,40 1.944,00 México 1.904,12 1.678,41 1.261,23 1.414,90 1.163,40 1.200,00 743,10 693,20 951,50 Ugan<strong>da</strong> 847,00 882,00 899,00 592,00 524,00 568,00 698,90 594,10 631,80 Indonésia 184,54 184,36 184,51 310,41 309,72 310,00 1.682,10 1.680,00 1.680,10 R. Dem. Coréia 350,00 360,00 360,00 300,00 310,00 310,00 857,10 861,10 861,10 Quênia 1.048,69 912,30 1.107,12 475,76 306,82 418,49 453,70 336,30 378,00 Outros 18.475,79 18.463,90 17.990,94 9.347,11 8.968,49 9.262.61 505,90 485,70 569,40 Mundo 38.780,43 413.30,03 39.162,76 22.853,43 21.978,98 22.289,80 589,30 531,80 569,20 Fonte: FAO. Tabela 4/I. Feijão - Área planta<strong>da</strong> produção e rendimento médio por estado - Brasil - Safras 2004/05-<strong>2006</strong>/07 Discriminação Área planta<strong>da</strong> (mil ha) Produção (mil t) Rendimento (kg/ha) 2004/05 2005/06 <strong>2006</strong>/07 2004/05 2005/06 <strong>2006</strong>/07 2004/05 2005/06 <strong>2006</strong>/07 Rondônia 64,4 62,5 61,1 39,9 35,4 41,2 620 566 674 Acre 16,6 15,8 15,0 9,3 8,7 8,2 560 551 547 Amazonas 5,0 6,9 6,7 4,5 3,7 6,0 900 536 896 Roraima 1,5 1,5 1,0 0,9 0,9 0,7 600 600 700 Pará 73,8 74,0 79,9 62,9 62,0 67,5 852 838 845 Amapá 1,0 1,0 1,4 4,5 0,6 1,1 600 600 786 Tocantins 12,1 12,4 16,5 11,3 9,9 18,9 934 798 1.145 Maranhão 77,0 84,7 86,8 35,4 38,1 39,1 460 450 450 Piauí 235,5 242,1 215,0 59,2 95,8 47,2 251 396 220 Ceará 503,0 546,6 574,0 158,1 258,3 137,2 314 473 239 Rio G. do Norte 66,8 80,2 80,1 24,8 37,1 26,0 371 463 325 Paraíba 202,1 204,1 206,1 62.7 118,4 87,0 310 580 422 Pernambuco 294,7 309,7 320,3 119,8 129,8 131,7 407 419 411 Alagoas 95,2 98,5 99,6 40,5 52,2 47,6 425 530 478 Sergipe 58,1 49,4 46,9 30,8 24,9 24,2 530 504 516 Bahia 768,7 728,3 720,0 418,0 337,0 307 544 463 426 Minas Gerais 433,7 459,2 411,1 566,0 536,6 490,9 1.305 1.169 1.194 Espírito Santo 26,6 24,3 23,1 20,2 18,3 17,9 759 750 775 Rio <strong>de</strong> Janeiro 6,5 6,6 6,8 5,5 5,8 5,8 846 879 853 São Paulo 164,2 191,1 192,3 250,6 287,1 313,9 1.526 1.502 1.632 Paraná 425,1 575,3 563,3 533,2 743,5 795,7 1.254 1.292 1.413 <strong>Santa</strong> <strong>Catarina</strong> 113,3 122,4 127,4 115,5 155,4 196,8 1.019 1.270 1.545 Rio G. do Sul 111,7 120,1 119,6 74,6 115,7 142,7 668 963 1.193 M. G. do Sul (1) 20,1 30,7 21,8 22,1 29,0 25,6 1.100 945 1.147 Mato Grosso 42,6 30,5 36,3 67,8 45,8 51,3 1.592 1.502 1.413 Goiás 115,3 127,6 129,4 274,5 286,9 274,9 2.381 2.248 2.124 Distrito Fe<strong>de</strong>ral 14,6 18,0 17,9 36,8 34,3 45,2 2.521 1.906 2.525 Brasil 3.949,2 4.223,6 4.179,4 3.045,5 3.471,2 3.351,3 771 822 802 (1) Safra, mais safrinha e terceira safra. Fonte: Conab (jul./07). 76 Síntese <strong>Anual</strong> <strong>da</strong> <strong>Agricultura</strong> <strong>de</strong> <strong>Santa</strong> <strong>Catarina</strong> <strong>2006</strong>/<strong>2007</strong>
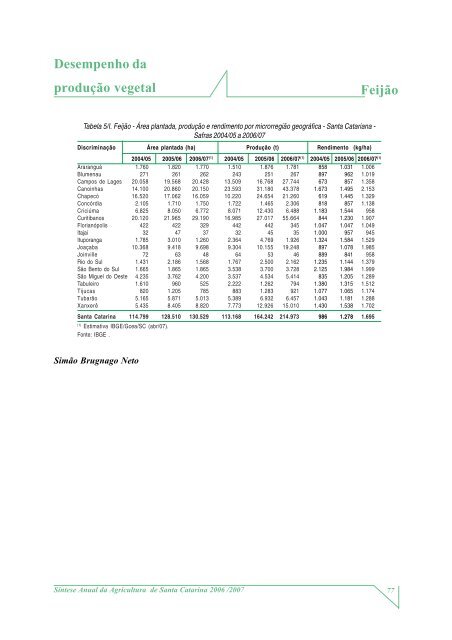
Desempenho <strong>da</strong> produção vegetal Feijão Tabela 5/I. Feijão - Área planta<strong>da</strong>, produção e rendimento por microrregião geográfica - <strong>Santa</strong> Catariana - Safras 2004/05 a <strong>2006</strong>/07 Discriminação Área planta<strong>da</strong> (ha) Produção (t) Rendimento (kg/ha) 2004/05 2005/06 <strong>2006</strong>/07 (1) 2004/05 2005/06 <strong>2006</strong>/07 (1) 2004/05 2005/06 <strong>2006</strong>/07 (1) Araranguá 1.760 1.820 1.770 1.510 1.876 1.781 858 1.031 1.006 Blumenau 271 261 262 243 251 267 897 962 1.019 Campos <strong>de</strong> Lages 20.058 19.568 20.428 13.509 16.768 27.744 673 857 1.358 Canoinhas 14.100 20.860 20.150 23.593 31.180 43.378 1.673 1.495 2.153 Chapecó 16.520 17.062 16.059 10.220 24.654 21.260 619 1.445 1.329 Concórdia 2.105 1.710 1.750 1.722 1.465 2.306 818 857 1.138 Criciúma 6.825 8.050 6.772 8.071 12.430 6.488 1.183 1.544 958 Curitibanos 20.120 21.965 29.190 16.985 27.017 55.664 844 1.230 1.907 Florianópolis 422 422 329 442 442 345 1.047 1.047 1.049 Itajaí 32 47 37 32 45 35 1.000 957 945 Ituporanga 1.785 3.010 1.260 2.364 4.769 1.926 1.324 1.584 1.529 Joaçaba 10.368 9.418 9.698 9.304 10.155 19.248 897 1.078 1.985 Joinville 72 63 48 64 53 46 889 841 958 Rio do Sul 1.431 2.186 1.568 1.767 2.500 2.162 1.235 1.144 1.379 São Bento do Sul 1.665 1.865 1.865 3.538 3.700 3.728 2.125 1.984 1.999 São Miguel do Oeste 4.235 3.762 4.200 3.537 4.534 5.414 835 1.205 1.289 Tabuleiro 1.610 960 525 2.222 1.262 794 1.380 1.315 1.512 Tijucas 820 1.205 785 883 1.283 921 1.077 1.065 1.174 Tubarão 5.165 5.871 5.013 5.389 6.932 6.457 1.043 1.181 1.288 Xanxerê 5.435 8.405 8.820 7.773 12.926 15.010 1.430 1.538 1.702 <strong>Santa</strong> <strong>Catarina</strong> 114.799 128.510 130.529 113.168 164.242 214.973 986 1.278 1.695 (1) Estimativa IBGE/Gcea/SC (abr/07). Fonte: IBGE . Simão Brugnago Neto Síntese <strong>Anual</strong> <strong>da</strong> <strong>Agricultura</strong> <strong>de</strong> <strong>Santa</strong> <strong>Catarina</strong> <strong>2006</strong> /<strong>2007</strong> 77