

SÃntese Anual da Agricultura de Santa Catarina - 2006-2007 - Cepa
SÃntese Anual da Agricultura de Santa Catarina - 2006-2007 - Cepa
SÃntese Anual da Agricultura de Santa Catarina - 2006-2007 - Cepa

You also want an ePaper? Increase the reach of your titles
YUMPU automatically turns print PDFs into web optimized ePapers that Google loves.
Florestal<br />
Desempenho do<br />
setor florestal<br />
Tabela 11/I. Consumo <strong>de</strong> ma<strong>de</strong>iras em toras para uso industrial por espécie,<br />
segundo os principais segmentos industriais - Brasil – 2005-06<br />
(1.000 m³)<br />
Segmento industrial Pínus Eucalipto Total<br />
2005 <strong>2006</strong> 2005 <strong>2006</strong> 2005 <strong>2006</strong><br />
Painéis reconstituídos 5.275 5.509 1.795 1.718 7.070 7.226<br />
Compensado 6.950 7.228 150 178 7.100 7.406<br />
Serrados 25.647 26.545 3.118 3.336 28.765 29.881<br />
Celulose e papel 7.139 7.185 38.893 39.576 46.032 46.761<br />
Carvão 0 0 31.934 34.537 31.934 34.537<br />
Outros 6.358 6.470 23.537 23.988 29.895 30.458<br />
Brasil 51.369 52.937 99.427 103.332 150.796 156.269<br />
Fonte: Abraf – Anuário Estatístico <strong>da</strong> Abraf – <strong>2007</strong>.<br />
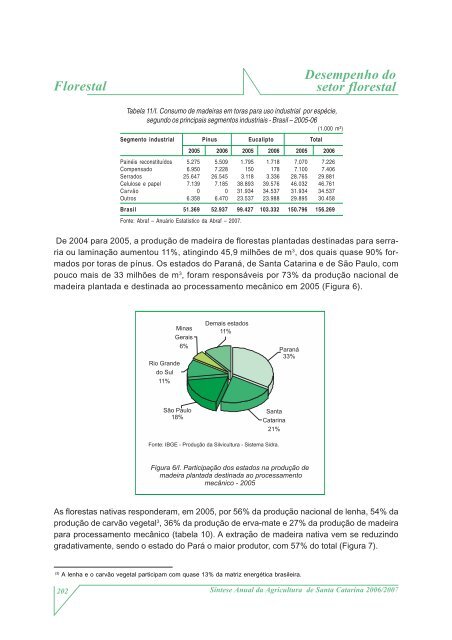
De 2004 para 2005, a produção <strong>de</strong> ma<strong>de</strong>ira <strong>de</strong> florestas planta<strong>da</strong>s <strong>de</strong>stina<strong>da</strong>s para serraria<br />
ou laminação aumentou 11%, atingindo 45,9 milhões <strong>de</strong> m 3 , dos quais quase 90% formados<br />
por toras <strong>de</strong> pínus. Os estados do Paraná, <strong>de</strong> <strong>Santa</strong> <strong>Catarina</strong> e <strong>de</strong> São Paulo, com<br />
pouco mais <strong>de</strong> 33 milhões <strong>de</strong> m 3 , foram responsáveis por 73% <strong>da</strong> produção nacional <strong>de</strong><br />
ma<strong>de</strong>ira planta<strong>da</strong> e <strong>de</strong>stina<strong>da</strong> ao processamento mecânico em 2005 (Figura 6).<br />
Minas<br />
Gerais<br />
6%<br />
Rio Gran<strong>de</strong><br />
do Sul<br />
11%<br />
Demais estados<br />
11%<br />
Paraná<br />
33%<br />
São Paulo<br />
18%<br />
<strong>Santa</strong><br />
<strong>Catarina</strong><br />
21%<br />
Fonte: IBGE - Produção <strong>da</strong> Silvicultura - Sistema Sidra.<br />
Figura 6/I. Participação dos estados na produção <strong>de</strong><br />
ma<strong>de</strong>ira planta<strong>da</strong> <strong>de</strong>stina<strong>da</strong> ao processamento<br />
mecânico - 2005<br />
As florestas nativas respon<strong>de</strong>ram, em 2005, por 56% <strong>da</strong> produção nacional <strong>de</strong> lenha, 54% <strong>da</strong><br />
produção <strong>de</strong> carvão vegetal 3 , 36% <strong>da</strong> produção <strong>de</strong> erva-mate e 27% <strong>da</strong> produção <strong>de</strong> ma<strong>de</strong>ira<br />
para processamento mecânico (tabela 10). A extração <strong>de</strong> ma<strong>de</strong>ira nativa vem se reduzindo<br />
gra<strong>da</strong>tivamente, sendo o estado do Pará o maior produtor, com 57% do total (Figura 7).<br />
(3)<br />
A lenha e o carvão vegetal participam com quase 13% <strong>da</strong> matriz energética brasileira.<br />
202<br />
Síntese <strong>Anual</strong> <strong>da</strong> <strong>Agricultura</strong> <strong>de</strong> <strong>Santa</strong> <strong>Catarina</strong> <strong>2006</strong>/<strong>2007</strong>


