

SÃntese Anual da Agricultura de Santa Catarina - 2006-2007 - Cepa
SÃntese Anual da Agricultura de Santa Catarina - 2006-2007 - Cepa
SÃntese Anual da Agricultura de Santa Catarina - 2006-2007 - Cepa

You also want an ePaper? Increase the reach of your titles
YUMPU automatically turns print PDFs into web optimized ePapers that Google loves.
Leite<br />
Desempenho <strong>da</strong><br />
produção animal<br />
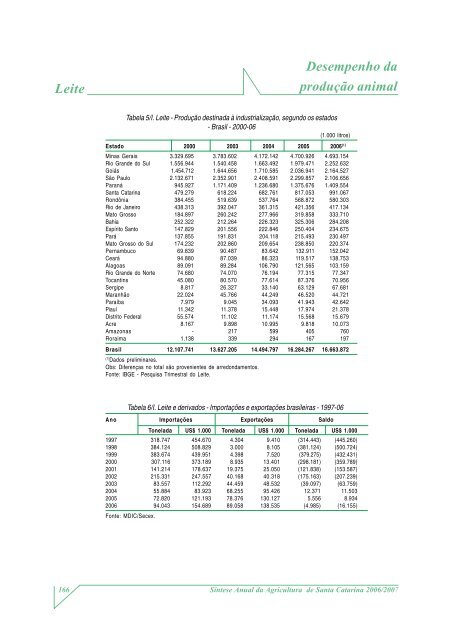
Tabela 5/I. Leite - Produção <strong>de</strong>stina<strong>da</strong> à industrialização, segundo os estados<br />
- Brasil - 2000-06<br />
(1.000 litros)<br />
Estado 2000 2003 2004 2005 <strong>2006</strong> (1)<br />
Minas Gerais 3.329.695 3.783.602 4.172.142 4.700.926 4.693.154<br />
Rio Gran<strong>de</strong> do Sul 1.556.944 1.540.458 1.663.492 1.979.471 2.252.632<br />
Goiás 1.454.712 1.644.656 1.710.585 2.036.941 2.164.527<br />
São Paulo 2.132.671 2.352.901 2.408.591 2.299.857 2.106.656<br />
Paraná 945.927 1.171.409 1.236.680 1.375.676 1.409.554<br />
<strong>Santa</strong> <strong>Catarina</strong> 479.279 618.224 682.761 817.053 991.067<br />
Rondônia 384.455 519.639 537.764 568.872 580.303<br />
Rio <strong>de</strong> Janeiro 438.313 392.047 361.315 421.356 417.134<br />
Mato Grosso 184.897 260.242 277.966 319.858 333.710<br />
Bahia 252.322 212.264 226.323 325.306 284.208<br />
Espírito Santo 147.829 201.556 222.846 250.404 234.675<br />
Pará 137.855 191.831 204.118 215.493 230.497<br />
Mato Grosso do Sul 174.232 202.860 209.654 238.850 220.374<br />
Pernambuco 69.839 90.487 83.642 132.911 152.042<br />
Ceará 94.880 87.039 86.323 119.517 138.753<br />
Alagoas 89.091 89.284 106.790 121.565 103.159<br />
Rio Gran<strong>de</strong> do Norte 74.680 74.070 76.194 77.315 77.347<br />
Tocantins 45.080 80.570 77.614 87.376 70.956<br />
Sergipe 8.817 26.327 33.140 63.129 67.681<br />
Maranhão 22.024 45.766 44.249 46.520 44.721<br />
Paraíba 7.979 9.045 34.093 41.943 42.642<br />
Piauí 11.342 11.378 15.448 17.974 21.378<br />
Distrito Fe<strong>de</strong>ral 55.574 11.102 11.174 15.568 15.679<br />
Acre 8.167 9.898 10.995 9.818 10.073<br />
Amazonas - 217 599 405 760<br />
Roraima 1.138 339 294 167 197<br />
Brasil 12.107.741 13.627.205 14.494.797 16.284.267 16.663.872<br />
(1)<br />
Dados preliminares.<br />
Obs: Diferenças no total são provenientes <strong>de</strong> arredon<strong>da</strong>mentos.<br />
Fonte: IBGE - Pesquisa Trimestral do Leite.<br />
Tabela 6/I. Leite e <strong>de</strong>rivados - Importações e exportações brasileiras - 1997-06<br />
Ano Importações Exportações Saldo<br />
Tonela<strong>da</strong> US$ 1.000 Tonela<strong>da</strong> US$ 1.000 Tonela<strong>da</strong> US$ 1.000<br />
1997 318.747 454.670 4.304 9.410 (314.443) (445.260)<br />
1998 384.124 508.829 3.000 8.105 (381.124) (500.724)<br />
1999 383.674 439.951 4.398 7.520 (379.275) (432.431)<br />
2000 307.116 373.189 8.935 13.401 (298.181) (359.789)<br />
2001 141.214 178.637 19.375 25.050 (121.838) (153.587)<br />
2002 215.331 247.557 40.168 40.318 (175.163) (207.239)<br />
2003 83.557 112.292 44.459 48.532 (39.097) (63.759)<br />
2004 55.884 83.923 68.255 95.426 12.371 11.503<br />
2005 72.820 121.193 78.376 130.127 5.556 8.934<br />
<strong>2006</strong> 94.043 154.689 89.058 138.535 (4.985) (16.155)<br />
Fonte: MDIC/Secex.<br />
166<br />
Síntese <strong>Anual</strong> <strong>da</strong> <strong>Agricultura</strong> <strong>de</strong> <strong>Santa</strong> <strong>Catarina</strong> <strong>2006</strong>/<strong>2007</strong>


