

SÃntese Anual da Agricultura de Santa Catarina - 2006-2007 - Cepa
SÃntese Anual da Agricultura de Santa Catarina - 2006-2007 - Cepa
SÃntese Anual da Agricultura de Santa Catarina - 2006-2007 - Cepa

You also want an ePaper? Increase the reach of your titles
YUMPU automatically turns print PDFs into web optimized ePapers that Google loves.
Desempenho <strong>da</strong> economia<br />
mundial e brasileira e <strong>da</strong><br />
comercialização internacional<br />
<strong>de</strong> produtos do agronegócio<br />
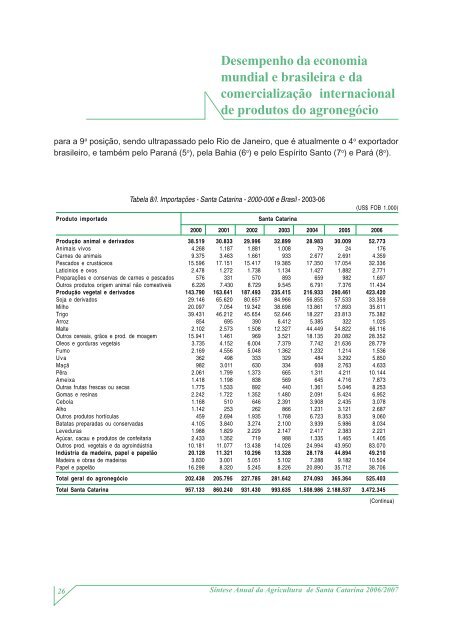
para a 9 a posição, sendo ultrapassado pelo Rio <strong>de</strong> Janeiro, que é atualmente o 4 o exportador<br />
brasileiro, e também pelo Paraná (5 o ), pela Bahia (6 o ) e pelo Espírito Santo (7 o ) e Pará (8 o ).<br />
Tabela 8/I. Importações - <strong>Santa</strong> <strong>Catarina</strong> - 2000-006 e Brasil - 2003-06<br />
(US$ FOB 1.000)<br />
Produto importado<br />
<strong>Santa</strong> <strong>Catarina</strong><br />
2000 2001 2002 2003 2004 2005 <strong>2006</strong><br />
Produção animal e <strong>de</strong>rivados 38.519 30.833 29.996 32.899 28.983 30.009 52.773<br />
Animais vivos 4.268 1.187 1.881 1.008 79 24 176<br />
Carnes <strong>de</strong> animais 9.375 3.463 1.661 933 2.677 2.691 4.359<br />
Pescados e crustáceos 15.596 17.151 15.417 19.385 17.350 17.054 32.336<br />
Laticinios e ovos 2.478 1.272 1.738 1.134 1.427 1.882 2.771<br />
Preparações e conservas <strong>de</strong> carnes e pescados 576 331 570 893 659 982 1.697<br />
Outros produtos origem animal não comestiveis 6.226 7.430 8.729 9.545 6.791 7.376 11.434<br />
Produção vegetal e <strong>de</strong>rivados 143.790 163.641 187.493 235.415 216.933 290.461 423.420<br />
Soja e <strong>de</strong>rivados 29.146 65.620 80.657 84.966 56.855 57.533 33.359<br />
Milho 20.097 7.054 19.342 38.698 13.861 17.893 35.611<br />
Trigo 39.431 46.212 45.654 52.646 18.227 23.813 75.382<br />
Arroz 854 695 390 6.412 5.385 322 1.025<br />
Malte 2.102 2.573 1.508 12.327 44.449 54.822 66.116<br />
Outros cereais, grãos e prod. <strong>de</strong> moagem 15.941 1.461 969 3.521 18.135 20.082 28.352<br />
Oleos e gorduras vegetais 3.735 4.152 6.004 7.379 7.742 21.636 28.779<br />
Fumo 2.169 4.556 5.048 1.362 1.232 1.214 1.536<br />
Uva 362 498 333 329 484 3.292 5.850<br />
Maçã 982 3.011 630 334 608 2.763 4.633<br />
Pêra 2.061 1.799 1.373 665 1.311 4.211 10.144<br />
Ameixa 1.418 1.198 838 569 645 4.716 7.873<br />
Outras frutas frescas ou secas 1.775 1.533 892 440 1.361 5.046 8.253<br />
Gomas e resinas 2.242 1.722 1.352 1.480 2.091 5.424 6.952<br />
Cebola 1.168 510 646 2.391 3.908 2.435 3.078<br />
Alho 1.142 253 262 866 1.231 3.121 2.687<br />
Outros produtos hortículas 459 2.694 1.935 1.768 6.723 8.353 9.060<br />
Batatas prepara<strong>da</strong>s ou conserva<strong>da</strong>s 4.105 3.840 3.274 2.100 3.939 5.986 8.034<br />
Leveduras 1.988 1.829 2.229 2.147 2.417 2.383 2.221<br />
Açúcar, cacau e produtos <strong>de</strong> confeitaria 2.433 1.352 719 988 1.335 1.465 1.405<br />
Outros prod. vegetais e <strong>da</strong> agroindústria 10.181 11.077 13.438 14.026 24.994 43.950 83.070<br />
Indústria <strong>da</strong> ma<strong>de</strong>ira, papel e papelão 20.128 11.321 10.296 13.328 28.178 44.894 49.210<br />
Ma<strong>de</strong>ira e obras <strong>de</strong> ma<strong>de</strong>iras 3.830 3.001 5.051 5.102 7.288 9.182 10.504<br />
Papel e papelão 16.298 8.320 5.245 8.226 20.890 35.712 38.706<br />
Total geral do agronegócio 202.438 205.795 227.785 281.642 274.093 365.364 525.403<br />
Total <strong>Santa</strong> <strong>Catarina</strong> 957.133 860.240 931.430 993.635 1.508.986 2.188.537 3.472.345<br />
(Continua)<br />
26<br />
Síntese <strong>Anual</strong> <strong>da</strong> <strong>Agricultura</strong> <strong>de</strong> <strong>Santa</strong> <strong>Catarina</strong> <strong>2006</strong>/<strong>2007</strong>


