

SÃntese Anual da Agricultura de Santa Catarina - 2006-2007 - Cepa
SÃntese Anual da Agricultura de Santa Catarina - 2006-2007 - Cepa
SÃntese Anual da Agricultura de Santa Catarina - 2006-2007 - Cepa

You also want an ePaper? Increase the reach of your titles
YUMPU automatically turns print PDFs into web optimized ePapers that Google loves.
Florestal<br />
Desempenho do<br />
setor florestal<br />
Panorama Mundial<br />
Produção, consumo e comércio internacional <strong>de</strong> produtos florestais (1)<br />
Mercado mundial <strong>de</strong> produtos florestais em expansão, com gran<strong>de</strong>s oportuni<strong>da</strong><strong>de</strong>s<br />
para os países do Hemisfério Sul no mercado <strong>de</strong> celulose<br />
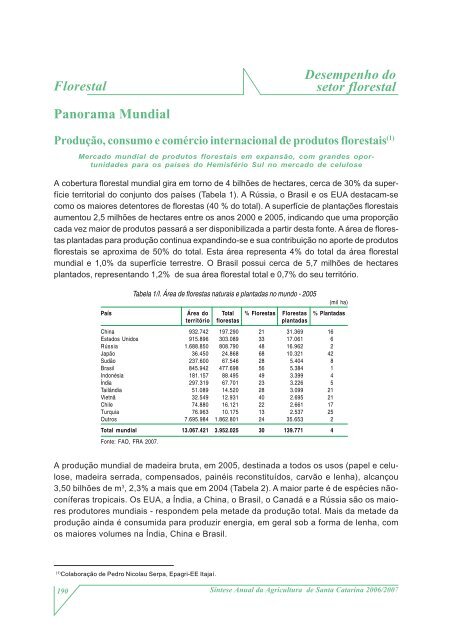
A cobertura florestal mundial gira em torno <strong>de</strong> 4 bilhões <strong>de</strong> hectares, cerca <strong>de</strong> 30% <strong>da</strong> superfície<br />
territorial do conjunto dos países (Tabela 1). A Rússia, o Brasil e os EUA <strong>de</strong>stacam-se<br />
como os maiores <strong>de</strong>tentores <strong>de</strong> florestas (40 % do total). A superfície <strong>de</strong> plantações florestais<br />
aumentou 2,5 milhões <strong>de</strong> hectares entre os anos 2000 e 2005, indicando que uma proporção<br />
ca<strong>da</strong> vez maior <strong>de</strong> produtos passará a ser disponibiliza<strong>da</strong> a partir <strong>de</strong>sta fonte. A área <strong>de</strong> florestas<br />
planta<strong>da</strong>s para produção continua expandindo-se e sua contribuição no aporte <strong>de</strong> produtos<br />
florestais se aproxima <strong>de</strong> 50% do total. Esta área representa 4% do total <strong>da</strong> área florestal<br />
mundial e 1,0% <strong>da</strong> superfície terrestre. O Brasil possui cerca <strong>de</strong> 5,7 milhões <strong>de</strong> hectares<br />
plantados, representando 1,2% <strong>de</strong> sua área florestal total e 0,7% do seu território.<br />
Tabela 1/I. Área <strong>de</strong> florestas naturais e planta<strong>da</strong>s no mundo - 2005<br />
(mil ha)<br />
País Área do Total % Florestas Florestas % Planta<strong>da</strong>s<br />
território florestas planta<strong>da</strong>s<br />
China 932.742 197.290 21 31.369 16<br />
Estados Unidos 915.896 303.089 33 17.061 6<br />
Rússia 1.688.850 808.790 48 16.962 2<br />
Japão 36.450 24.868 68 10.321 42<br />
Sudão 237.600 67.546 28 5.404 8<br />
Brasil 845.942 477.698 56 5.384 1<br />
Indonésia 181.157 88.495 49 3.399 4<br />
Índia 297.319 67.701 23 3.226 5<br />
Tailândia 51.089 14.520 28 3.099 21<br />
Vietnã 32.549 12.931 40 2.695 21<br />
Chile 74.880 16.121 22 2.661 17<br />
Turquia 76.963 10.175 13 2.537 25<br />
Outros 7.695.984 1.862.801 24 35.653 2<br />
Total mundial 13.067.421 3.952.025 30 139.771 4<br />
Fonte: FAO, FRA <strong>2007</strong>.<br />
A produção mundial <strong>de</strong> ma<strong>de</strong>ira bruta, em 2005, <strong>de</strong>stina<strong>da</strong> a todos os usos (papel e celulose,<br />
ma<strong>de</strong>ira serra<strong>da</strong>, compensados, painéis reconstituídos, carvão e lenha), alcançou<br />
3,50 bilhões <strong>de</strong> m 3 , 2,3% a mais que em 2004 (Tabela 2). A maior parte é <strong>de</strong> espécies nãoconíferas<br />
tropicais. Os EUA, a Índia, a China, o Brasil, o Canadá e a Rússia são os maiores<br />
produtores mundiais - respon<strong>de</strong>m pela meta<strong>de</strong> <strong>da</strong> produção total. Mais <strong>da</strong> meta<strong>de</strong> <strong>da</strong><br />
produção ain<strong>da</strong> é consumi<strong>da</strong> para produzir energia, em geral sob a forma <strong>de</strong> lenha, com<br />
os maiores volumes na Índia, China e Brasil.<br />
(1)<br />
Colaboração <strong>de</strong> Pedro Nicolau Serpa, Epagri-EE Itajaí.<br />
190<br />
Síntese <strong>Anual</strong> <strong>da</strong> <strong>Agricultura</strong> <strong>de</strong> <strong>Santa</strong> <strong>Catarina</strong> <strong>2006</strong>/<strong>2007</strong>


