

SÃntese Anual da Agricultura de Santa Catarina - 2006-2007 - Cepa
SÃntese Anual da Agricultura de Santa Catarina - 2006-2007 - Cepa
SÃntese Anual da Agricultura de Santa Catarina - 2006-2007 - Cepa

Create successful ePaper yourself
Turn your PDF publications into a flip-book with our unique Google optimized e-Paper software.
Trigo<br />
Desempenho <strong>da</strong><br />
produção vegetal<br />
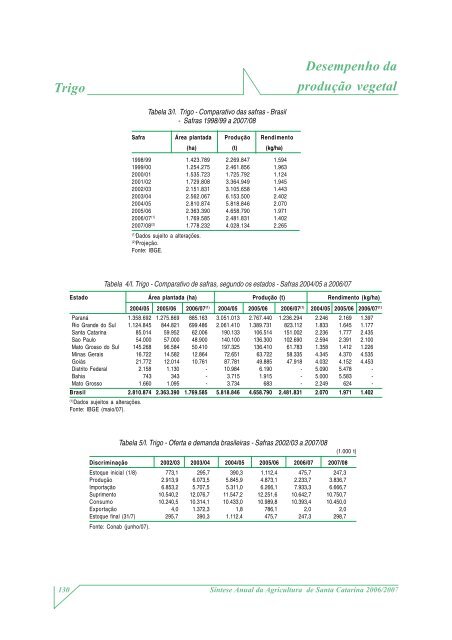
Tabela 3/I. Trigo - Comparativo <strong>da</strong>s safras - Brasil<br />
- Safras 1998/99 a <strong>2007</strong>/08<br />
Safra Área planta<strong>da</strong> Produção Rendimento<br />
1998/99 1.423.789 2.269.847 1.594<br />
1999/00 1.254.275 2.461.856 1.963<br />
2000/01 1.535.723 1.725.792 1.124<br />
2001/02 1.729.808 3.364.949 1.945<br />
2002/03 2.151.831 3.105.658 1.443<br />
2003/04 2.562.067 6.153.500 2.402<br />
2004/05 2.810.874 5.818.846 2.070<br />
2005/06 2.363.390 4.658.790 1.971<br />
<strong>2006</strong>/07 (1) 1.769.585 2.481.831 1.402<br />
<strong>2007</strong>/08 (2) 1.778.232 4.028.134 2.265<br />
(1)<br />
Dados sujeito a alterações.<br />
(2)<br />
Projeção.<br />
Fonte: IBGE.<br />
(ha) (t) (kg/ha)<br />
Tabela 4/I. Trigo - Comparativo <strong>de</strong> safras, segundo os estados - Safras 2004/05 a <strong>2006</strong>/07<br />
Estado Área planta<strong>da</strong> (ha) Produção (t) Rendimento (kg/ha)<br />
Paraná 1.358.692 1.275.869 885.163 3.051.013 2.767.440 1.236.294 2.246 2.169 1.397<br />
Rio Gran<strong>de</strong> do Sul 1.124.845 844.821 699.486 2.061.410 1.389.731 823.112 1.833 1.645 1.177<br />
<strong>Santa</strong> <strong>Catarina</strong> 85.014 59.952 62.006 190.133 106.514 151.002 2.236 1.777 2.435<br />
Sao Paulo 54.000 57.000 48.900 140.100 136.300 102.690 2.594 2.391 2.100<br />
Mato Grosso do Sul 145.268 96.584 50.410 197.325 136.410 61.783 1.358 1.412 1.226<br />
Minas Gerais 16.722 14.582 12.864 72.651 63.722 58.335 4.345 4.370 4.535<br />
Goiás 21.772 12.014 10.761 87.781 49.885 47.918 4.032 4.152 4.453<br />
Distrito Fe<strong>de</strong>ral 2.158 1.130 - 10.984 6.190 - 5.090 5.478 -<br />
Bahia 743 343 - 3.715 1.915 - 5.000 5.583 -<br />
Mato Grosso 1.660 1.095 - 3.734 683 - 2.249 624 -<br />
Brasil 2.810.874 2.363.390 1.769.585 5.818.846 4.658.790 2.481.831 2.070 1.971 1.402<br />
(1)<br />
Dados sujeitos a alterações.<br />
Fonte: IBGE (maio/07).<br />
2004/05 2005/06 <strong>2006</strong>/07 (1) 2004/05 2005/06 <strong>2006</strong>/07 (1) 2004/05 2005/06 <strong>2006</strong>/07 (1)<br />
Tabela 5/I. Trigo - Oferta e <strong>de</strong>man<strong>da</strong> brasileiras - Safras 2002/03 a <strong>2007</strong>/08<br />
Discriminação 2002/03 2003/04 2004/05 2005/06 <strong>2006</strong>/07 <strong>2007</strong>/08<br />
(1.000 t)<br />
Estoque inicial (1/8) 773,1 295,7 390,3 1.112,4 475,7 247,3<br />
Produção 2.913,9 6.073,5 5.845,9 4.873,1 2.233,7 3.836,7<br />
Importação 6.853,2 5.707,5 5.311,0 6.266,1 7.933,3 6.666,7<br />
Suprimento 10.540,2 12.076,7 11.547,2 12.251,6 10.642,7 10.750,7<br />
Consumo 10.240,5 10.314,1 10.433,0 10.989,8 10.393,4 10.450,0<br />
Exportação 4,0 1.372,3 1,8 786,1 2,0 2,0<br />
Estoque final (31/7) 295,7 390,3 1.112,4 475,7 247,3 298,7<br />
Fonte: Conab (junho/07).<br />
130<br />
Síntese <strong>Anual</strong> <strong>da</strong> <strong>Agricultura</strong> <strong>de</strong> <strong>Santa</strong> <strong>Catarina</strong> <strong>2006</strong>/<strong>2007</strong>


