

SÃntese Anual da Agricultura de Santa Catarina - 2006-2007 - Cepa
SÃntese Anual da Agricultura de Santa Catarina - 2006-2007 - Cepa
SÃntese Anual da Agricultura de Santa Catarina - 2006-2007 - Cepa

Create successful ePaper yourself
Turn your PDF publications into a flip-book with our unique Google optimized e-Paper software.
Desempenho <strong>da</strong><br />
Arroz<br />
produção vegetal<br />
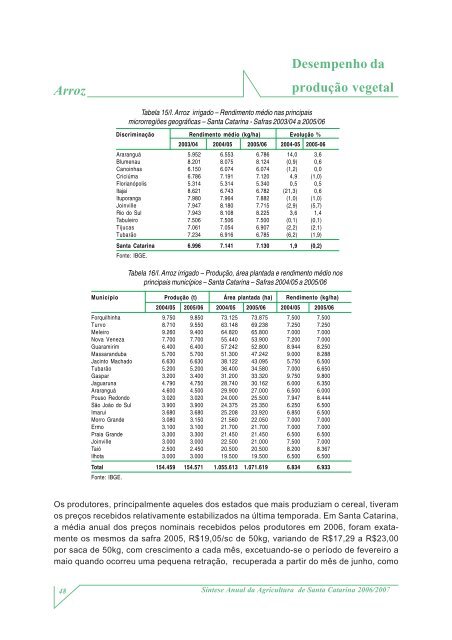
Tabela 15/I. Arroz irrigado – Rendimento médio nas principais<br />
microrregiões geográficas – <strong>Santa</strong> <strong>Catarina</strong> - Safras 2003/04 a 2005/06<br />
Discriminação Rendimento médio (kg/ha) Evolução %<br />
2003/04 2004/05 2005/06 2004-05 2005-06<br />
Araranguá 5.952 6.553 6.786 14,0 3,6<br />
Blumenau 8.201 8.075 8.124 (0,9) 0,6<br />
Canoinhas 6.150 6.074 6.074 (1,2) 0,0<br />
Criciúma 6.786 7.191 7.120 4,9 (1,0)<br />
Florianópolis 5.314 5.314 5.340 0,5 0,5<br />
Itajaí 8.621 6.743 6.782 (21,3) 0,6<br />
Ituporanga 7.980 7.964 7.882 (1,0) (1,0)<br />
Joinville 7.947 8.180 7.715 (2,9) (5,7)<br />
Rio do Sul 7.943 8.108 8.225 3,6 1,4<br />
Tabuleiro 7.506 7.506 7.500 (0,1) (0,1)<br />
Tijucas 7.061 7.054 6.907 (2,2) (2,1)<br />
Tubarão 7.234 6.916 6.785 (6,2) (1,9)<br />
<strong>Santa</strong> <strong>Catarina</strong> 6.996 7.141 7.130 1,9 (0,2)<br />
Fonte: IBGE.<br />
Tabela 16/I. Arroz irrigado – Produção, área planta<strong>da</strong> e rendimento médio nos<br />
principais municípios – <strong>Santa</strong> <strong>Catarina</strong> – Safras 2004/05 a 2005/06<br />
Município Produção (t) Área planta<strong>da</strong> (ha) Rendimento (kg/ha)<br />
2004/05 2005/06 2004/05 2005/06 2004/05 2005/06<br />
Forquilhinha 9.750 9.850 73.125 73.875 7.500 7.500<br />
Turvo 8.710 9.550 63.148 69.238 7.250 7.250<br />
Meleiro 9.260 9.400 64.820 65.800 7.000 7.000<br />
Nova Veneza 7.700 7.700 55.440 53.900 7.200 7.000<br />
Guaramirim 6.400 6.400 57.242 52.800 8.944 8.250<br />
Massaranduba 5.700 5.700 51.300 47.242 9.000 8.288<br />
Jacinto Machado 6.630 6.630 38.122 43.095 5.750 6.500<br />
Tubarão 5.200 5.200 36.400 34.580 7.000 6.650<br />
Gaspar 3.200 3.400 31.200 33.320 9.750 9.800<br />
Jaguaruna 4.790 4.750 28.740 30.162 6.000 6.350<br />
Araranguá 4.600 4.500 29.900 27.000 6.500 6.000<br />
Pouso Redondo 3.020 3.020 24.000 25.500 7.947 8.444<br />
São João do Sul 3.900 3.900 24.375 25.350 6.250 6.500<br />
Imarui 3.680 3.680 25.208 23.920 6.850 6.500<br />
Morro Gran<strong>de</strong> 3.080 3.150 21.560 22.050 7.000 7.000<br />
Ermo 3.100 3.100 21.700 21.700 7.000 7.000<br />
Praia Gran<strong>de</strong> 3.300 3.300 21.450 21.450 6.500 6.500<br />
Joinville 3.000 3.000 22.500 21.000 7.500 7.000<br />
Taió 2.500 2.450 20.500 20.500 8.200 8.367<br />
Ilhota 3.000 3.000 19.500 19.500 6.500 6.500<br />
Total 154.459 154.571 1.055.613 1.071.619 6.834 6.933<br />
Fonte: IBGE.<br />
Os produtores, principalmente aqueles dos estados que mais produziam o cereal, tiveram<br />
os preços recebidos relativamente estabilizados na última tempora<strong>da</strong>. Em <strong>Santa</strong> <strong>Catarina</strong>,<br />
a média anual dos preços nominais recebidos pelos produtores em <strong>2006</strong>, foram exatamente<br />
os mesmos <strong>da</strong> safra 2005, R$19,05/sc <strong>de</strong> 50kg, variando <strong>de</strong> R$17,29 a R$23,00<br />
por saca <strong>de</strong> 50kg, com crescimento a ca<strong>da</strong> mês, excetuando-se o período <strong>de</strong> fevereiro a<br />
maio quando ocorreu uma pequena retração, recupera<strong>da</strong> a partir do mês <strong>de</strong> junho, como<br />
48<br />
Síntese <strong>Anual</strong> <strong>da</strong> <strong>Agricultura</strong> <strong>de</strong> <strong>Santa</strong> <strong>Catarina</strong> <strong>2006</strong>/<strong>2007</strong>


