

SÃntese Anual da Agricultura de Santa Catarina - 2006-2007 - Cepa
SÃntese Anual da Agricultura de Santa Catarina - 2006-2007 - Cepa
SÃntese Anual da Agricultura de Santa Catarina - 2006-2007 - Cepa

Create successful ePaper yourself
Turn your PDF publications into a flip-book with our unique Google optimized e-Paper software.
Desempenho <strong>da</strong><br />
produção vegetal<br />
Fumo<br />
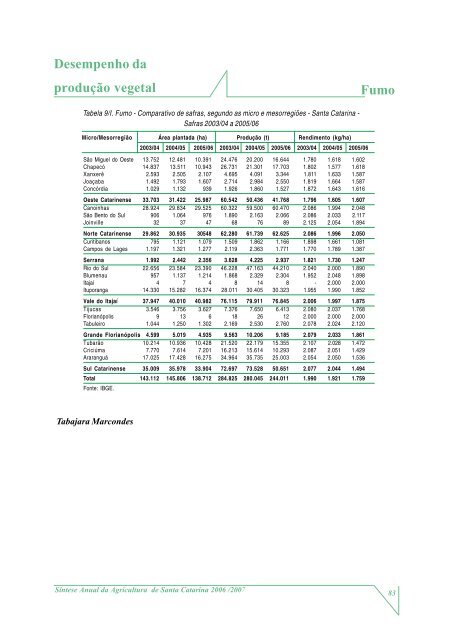
Tabela 9/I. Fumo - Comparativo <strong>de</strong> safras, segundo as micro e mesorregiões - <strong>Santa</strong> <strong>Catarina</strong> -<br />
Safras 2003/04 a 2005/06<br />
Micro/Mesorregião Área planta<strong>da</strong> (ha) Produção (t) Rendimento (kg/ha)<br />
2003/04 2004/05 2005/06 2003/04 2004/05 2005/06 2003/04 2004/05 2005/06<br />
São Miguel do Oeste 13.752 12.481 10.391 24.476 20.200 16.644 1.780 1.618 1.602<br />
Chapecó 14.837 13.511 10.943 26.731 21.301 17.703 1.802 1.577 1.618<br />
Xanxerê 2.593 2.505 2.107 4.695 4.091 3.344 1.811 1.633 1.587<br />
Joaçaba 1.492 1.793 1.607 2.714 2.984 2.550 1.819 1.664 1.587<br />
Concórdia 1.029 1.132 939 1.926 1.860 1.527 1.872 1.643 1.616<br />
Oeste Catarinense 33.703 31.422 25.987 60.542 50.436 41.768 1.796 1.605 1.607<br />
Canoinhas 28.924 29.834 29.525 60.322 59.500 60.470 2.086 1.994 2.048<br />
São Bento do Sul 906 1.064 976 1.890 2.163 2.066 2.086 2.033 2.117<br />
Joinville 32 37 47 68 76 89 2.125 2.054 1.894<br />
Norte Catarinense 29.862 30.935 30548 62.280 61.739 62.625 2.086 1.996 2.050<br />
Curitibanos 795 1.121 1.079 1.509 1.862 1.166 1.898 1.661 1.081<br />
Campos <strong>de</strong> Lages 1.197 1.321 1.277 2.119 2.363 1.771 1.770 1.789 1.387<br />
Serrana 1.992 2.442 2.356 3.628 4.225 2.937 1.821 1.730 1.247<br />
Rio do Sul 22.656 23.584 23.390 46.228 47.163 44.210 2.040 2.000 1.890<br />
Blumenau 957 1.137 1.214 1.868 2.329 2.304 1.952 2.048 1.898<br />
Itajaí 4 7 4 8 14 8 - 2.000 2.000<br />
Ituporanga 14.330 15.282 16.374 28.011 30.405 30.323 1.955 1.990 1.852<br />
Vale do Itajaí 37.947 40.010 40.982 76.115 79.911 76.845 2.006 1.997 1.875<br />
Tijucas 3.546 3.756 3.627 7.376 7.650 6.413 2.080 2.037 1.768<br />
Florianópolis 9 13 6 18 26 12 2.000 2.000 2.000<br />
Tabuleiro 1.044 1.250 1.302 2.169 2.530 2.760 2.078 2.024 2.120<br />
Gran<strong>de</strong> Florianópolis 4.599 5.019 4.935 9.563 10.206 9.185 2.079 2.033 1.861<br />
Tubarão 10.214 10.936 10.428 21.520 22.179 15.355 2.107 2.028 1.472<br />
Criciúma 7.770 7.614 7.201 16.213 15.614 10.293 2.087 2.051 1.429<br />
Araranguá 17.025 17.428 16.275 34.964 35.735 25.003 2.054 2.050 1.536<br />
Sul Catarinense 35.009 35.978 33.904 72.697 73.528 50.651 2.077 2.044 1.494<br />
Total 143.112 145.806 138.712 284.825 280.045 244.011 1.990 1.921 1.759<br />
Fonte: IBGE.<br />
Tabajara Marcon<strong>de</strong>s<br />
Síntese <strong>Anual</strong> <strong>da</strong> <strong>Agricultura</strong> <strong>de</strong> <strong>Santa</strong> <strong>Catarina</strong> <strong>2006</strong> /<strong>2007</strong><br />
83


