

SÃntese Anual da Agricultura de Santa Catarina - 2006-2007 - Cepa
SÃntese Anual da Agricultura de Santa Catarina - 2006-2007 - Cepa
SÃntese Anual da Agricultura de Santa Catarina - 2006-2007 - Cepa

Create successful ePaper yourself
Turn your PDF publications into a flip-book with our unique Google optimized e-Paper software.
Trigo<br />
Desempenho <strong>da</strong><br />
produção vegetal<br />
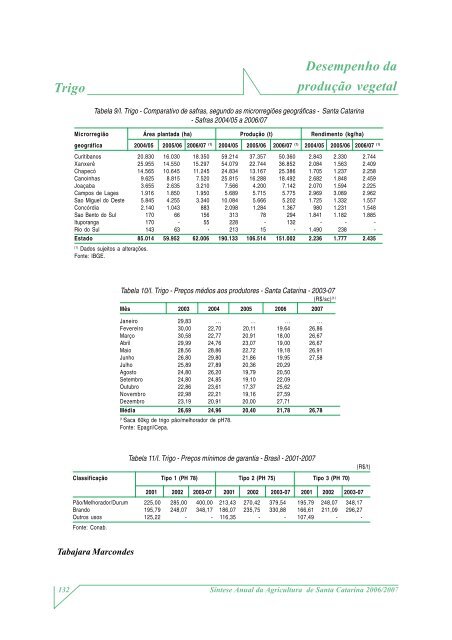
Tabela 9/I. Trigo - Comparativo <strong>de</strong> safras, segundo as microrregiões geográficas - <strong>Santa</strong> <strong>Catarina</strong><br />
- Safras 2004/05 a <strong>2006</strong>/07<br />
Microrregião Área planta<strong>da</strong> (ha) Produção (t) Rendimento (kg/ha)<br />
geográfica 2004/05 2005/06 <strong>2006</strong>/07 (1) 2004/05 2005/06 <strong>2006</strong>/07 (1) 2004/05 2005/06 <strong>2006</strong>/07 (1)<br />
Curitibanos 20.830 16.030 18.350 59.214 37.357 50.360 2.843 2.330 2.744<br />
Xanxerê 25.955 14.550 15.297 54.079 22.744 36.852 2.084 1.563 2.409<br />
Chapecó 14.565 10.645 11.245 24.834 13.167 25.386 1.705 1.237 2.258<br />
Canoinhas 9.625 8.815 7.520 25.815 16.288 18.492 2.682 1.848 2.459<br />
Joaçaba 3.655 2.635 3.210 7.566 4.200 7.142 2.070 1.594 2.225<br />
Campos <strong>de</strong> Lages 1.916 1.850 1.950 5.689 5.715 5.775 2.969 3.089 2.962<br />
Sao Miguel do Oeste 5.845 4.255 3.340 10.084 5.666 5.202 1.725 1.332 1.557<br />
Concórdia 2.140 1.043 883 2.098 1.284 1.367 980 1.231 1.548<br />
Sao Bento do Sul 170 66 156 313 78 294 1.841 1.182 1.885<br />
Ituporanga 170 - 55 228 - 132 - - -<br />
Rio do Sul 143 63 - 213 15 - 1.490 238 -<br />
Estado 85.014 59.952 62.006 190.133 106.514 151.002 2.236 1.777 2.435<br />
(1)<br />
Dados sujeitos a alterações.<br />
Fonte: IBGE.<br />
Tabela 10/I. Trigo - Preços médios aos produtores - <strong>Santa</strong> <strong>Catarina</strong> - 2003-07<br />
(R$/sc) ( ¹ )<br />
Mês 2003 2004 2005 <strong>2006</strong> <strong>2007</strong><br />
Janeiro 29,83 ... ... ... ...<br />
Fevereiro 30,00 22,70 20,11 19,64 26,86<br />
Março 30,58 22,77 20,91 18,00 26,67<br />
Abril 29,99 24,76 23,07 19,00 26,67<br />
Maio 28,56 28,86 22,72 19,18 26,91<br />
Junho 26,80 29,80 21,86 19,95 27,58<br />
Julho 25,89 27,89 20,36 20,29<br />
Agosto 24,80 26,20 19,79 20,50<br />
Setembro 24,80 24,85 19,10 22,09<br />
Outubro 22,86 23,61 17,37 25,62<br />
Novembro 22,98 22,21 19,16 27,59<br />
Dezembro 23,19 20,91 20,00 27,71<br />
Média 26,69 24,96 20,40 21,78 26,78<br />
(1)<br />
Saca 60kg <strong>de</strong> trigo pão/melhorador <strong>de</strong> pH78.<br />
Fonte: Epagri/<strong>Cepa</strong>.<br />
Tabela 11/I. Trigo - Preços mínimos <strong>de</strong> garantia - Brasil - 2001-<strong>2007</strong><br />
(R$/t)<br />
Classificação Tipo 1 (PH 78) Tipo 2 (PH 75) Tipo 3 (PH 70)<br />
2001 2002 2003-07 2001 2002 2003-07 2001 2002 2003-07<br />
Pão/Melhorador/Durum 225,00 285,00 400,00 213,43 270,42 379,54 195,79 248,07 348,17<br />
Brando 195,79 248,07 348,17 186,07 235,75 330,88 166,61 211,09 296,27<br />
Outros usos 125,22 - - 116,35 - - 107,49 - -<br />
Fonte: Conab.<br />
Tabajara Marcon<strong>de</strong>s<br />
132<br />
Síntese <strong>Anual</strong> <strong>da</strong> <strong>Agricultura</strong> <strong>de</strong> <strong>Santa</strong> <strong>Catarina</strong> <strong>2006</strong>/<strong>2007</strong>


