

SÃntese Anual da Agricultura de Santa Catarina - 2006-2007 - Cepa
SÃntese Anual da Agricultura de Santa Catarina - 2006-2007 - Cepa
SÃntese Anual da Agricultura de Santa Catarina - 2006-2007 - Cepa

Create successful ePaper yourself
Turn your PDF publications into a flip-book with our unique Google optimized e-Paper software.
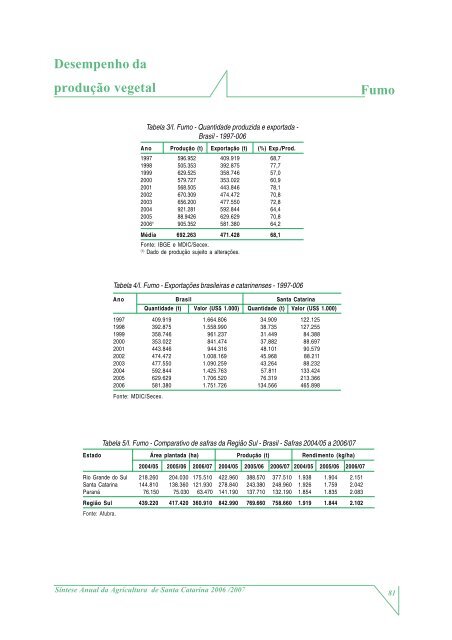
Desempenho <strong>da</strong><br />
produção vegetal<br />
Fumo<br />
Tabela 3/I. Fumo - Quanti<strong>da</strong><strong>de</strong> produzi<strong>da</strong> e exporta<strong>da</strong> -<br />
Brasil - 1997-006<br />
Ano Produção (t) Exportação (t) (%) Exp./Prod.<br />
1997 596.952 409.919 68,7<br />
1998 505.353 392.875 77,7<br />
1999 629.525 358.746 57,0<br />
2000 579.727 353.022 60,9<br />
2001 568.505 443.846 78,1<br />
2002 670.309 474.472 70,8<br />
2003 656.200 477.550 72,8<br />
2004 921.281 592.844 64,4<br />
2005 88.9426 629.629 70,8<br />
<strong>2006</strong>¹ 905.352 581.380 64,2<br />
Média 692.263 471.428 68,1<br />
Fonte: IBGE e MDIC/Secex.<br />
(1)<br />
Dado <strong>de</strong> produção sujeito a alterações.<br />
Tabela 4/I. Fumo - Exportações brasileiras e catarinenses - 1997-006<br />
Ano Brasil <strong>Santa</strong> <strong>Catarina</strong><br />
Quanti<strong>da</strong><strong>de</strong> (t) Valor (US$ 1.000) Quanti<strong>da</strong><strong>de</strong> (t) Valor (US$ 1.000)<br />
1997 409.919 1.664.806 34.909 122.125<br />
1998 392.875 1.558.990 38.735 127.255<br />
1999 358.746 961.237 31.449 84.388<br />
2000 353.022 841.474 37.882 88.697<br />
2001 443.846 944.316 48.101 90.579<br />
2002 474.472 1.008.169 45.968 88.211<br />
2003 477.550 1.090.259 43.264 88.232<br />
2004 592.844 1.425.763 57.811 133.424<br />
2005 629.629 1.706.520 76.319 213.366<br />
<strong>2006</strong> 581.380 1.751.726 134.566 465.898<br />
Fonte: MDIC/Secex.<br />
Tabela 5/I. Fumo - Comparativo <strong>de</strong> safras <strong>da</strong> Região Sul - Brasil - Safras 2004/05 a <strong>2006</strong>/07<br />
Estado Área planta<strong>da</strong> (ha) Produção (t) Rendimento (kg/ha)<br />
2004/05 2005/06 <strong>2006</strong>/07 2004/05 2005/06 <strong>2006</strong>/07 2004/05 2005/06 <strong>2006</strong>/07<br />
Rio Gran<strong>de</strong> do Sul 218.260 204.030 175.510 422.960 388.570 377.510 1.938 1.904 2.151<br />
<strong>Santa</strong> <strong>Catarina</strong> 144.810 138.360 121.930 278.840 243.380 248.960 1.926 1.759 2.042<br />
Paraná 76.150 75.030 63.470 141.190 137.710 132.190 1.854 1.835 2.083<br />
Região Sul 439.220 417.420 360.910 842.990 769.660 758.660 1.919 1.844 2.102<br />
Fonte: Afubra.<br />
Síntese <strong>Anual</strong> <strong>da</strong> <strong>Agricultura</strong> <strong>de</strong> <strong>Santa</strong> <strong>Catarina</strong> <strong>2006</strong> /<strong>2007</strong><br />
81


