

SÃntese Anual da Agricultura de Santa Catarina - 2006-2007 - Cepa
SÃntese Anual da Agricultura de Santa Catarina - 2006-2007 - Cepa
SÃntese Anual da Agricultura de Santa Catarina - 2006-2007 - Cepa

Create successful ePaper yourself
Turn your PDF publications into a flip-book with our unique Google optimized e-Paper software.
Carne bovina<br />
Desempenho <strong>da</strong><br />
produção animal<br />
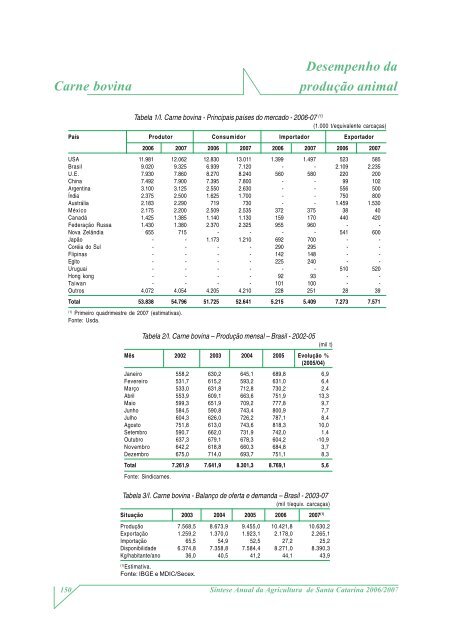
Tabela 1/I. Carne bovina - Principais países do mercado - <strong>2006</strong>-07 (1)<br />
(1.000 t/equivalente carcaças)<br />
País Produtor Consumidor Importador Exportador<br />
<strong>2006</strong> <strong>2007</strong> <strong>2006</strong> <strong>2007</strong> <strong>2006</strong> <strong>2007</strong> <strong>2006</strong> <strong>2007</strong><br />
USA 11.981 12.062 12.830 13.011 1.399 1.497 523 585<br />
Brasil 9.020 9.325 6.939 7.120 - - 2.109 2.235<br />
U.E. 7.930 7.860 8.270 8.240 560 580 220 200<br />
China 7.492 7.900 7.395 7.800 - - 99 102<br />
Argentina 3.100 3.125 2.550 2.630 - - 556 500<br />
Índia 2.375 2.500 1.625 1.700 - - 750 800<br />
Austrália 2.183 2.290 719 730 - - 1.459 1.530<br />
México 2.175 2.200 2.509 2.535 372 375 38 40<br />
Canadá 1.425 1.385 1.140 1.130 159 170 440 420<br />
Fe<strong>de</strong>ração Russa 1.430 1.380 2.370 2.325 955 960 - -<br />
Nova Zelândia 655 715 - - - - 541 600<br />
Japão - - 1.173 1.210 692 700 - -<br />
Coréia do Sul - - - - 290 295 - -<br />
Flipinas - - - - 142 148 - -<br />
Egito - - - - 225 240 - -<br />
Uruguai - - - - - - 510 520<br />
Hong kong - - - - 92 93 - -<br />
Taiwan - - - - 101 100 - -<br />
Outros 4.072 4.054 4.205 4.210 228 251 28 39<br />
Total 53.838 54.796 51.725 52.641 5.215 5.409 7.273 7.571<br />
(1)<br />
Primeiro quadrimestre <strong>de</strong> <strong>2007</strong> (estimativas).<br />
Fonte: Us<strong>da</strong>.<br />
Tabela 2/I. Carne bovina – Produção mensal – Brasil - 2002-05<br />
Mês 2002 2003 2004 2005 Evolução %<br />
(2005/04)<br />
(mil t)<br />
Janeiro 558,2 630,2 645,1 689,8 6,9<br />
Fevereiro 531,7 615,2 593,2 631,0 6,4<br />
Março 533,0 631,8 712,8 730,2 2,4<br />
Abril 553,9 609,1 663,6 751,9 13,3<br />
Maio 599,3 651,9 709,2 777,8 9,7<br />
Junho 584,5 590,8 743,4 800,9 7,7<br />
Julho 604,3 626,0 726,2 787,1 8,4<br />
Agosto 751,8 613,0 743,6 818,3 10,0<br />
Setembro 590,7 662,0 731,9 742,0 1,4<br />
Outubro 637,3 679,1 678,3 604,2 -10,9<br />
Novembro 642,2 618,8 660,3 684,8 3,7<br />
Dezembro 675,0 714,0 693,7 751,1 8,3<br />
Total 7.261,9 7.641,9 8.301,3 8.769,1 5,6<br />
Fonte: Sindicarnes.<br />
Tabela 3/I. Carne bovina - Balanço <strong>de</strong> oferta e <strong>de</strong>man<strong>da</strong> – Brasil - 2003-07<br />
(mil t/equiv. carcaças)<br />
Situação 2003 2004 2005 <strong>2006</strong> <strong>2007</strong> (1)<br />
Produção 7.568,5 8.673,9 9.455,0 10.421,8 10.630,2<br />
Exportação 1.259,2 1.370,0 1.923,1 2.178,0 2.265,1<br />
Importação 65,5 54,9 52,5 27,2 25,2<br />
Disponibili<strong>da</strong><strong>de</strong> 6.374,8 7.358,8 7.584,4 8.271,0 8.390,3<br />
Kg/habitante/ano 36,0 40,5 41,2 44,1 43,9<br />
(1)<br />
Estimativa.<br />
Fonte: IBGE e MDIC/Secex.<br />
150<br />
Síntese <strong>Anual</strong> <strong>da</strong> <strong>Agricultura</strong> <strong>de</strong> <strong>Santa</strong> <strong>Catarina</strong> <strong>2006</strong>/<strong>2007</strong>


