

SÃntese Anual da Agricultura de Santa Catarina - 2006-2007 - Cepa
SÃntese Anual da Agricultura de Santa Catarina - 2006-2007 - Cepa
SÃntese Anual da Agricultura de Santa Catarina - 2006-2007 - Cepa

You also want an ePaper? Increase the reach of your titles
YUMPU automatically turns print PDFs into web optimized ePapers that Google loves.
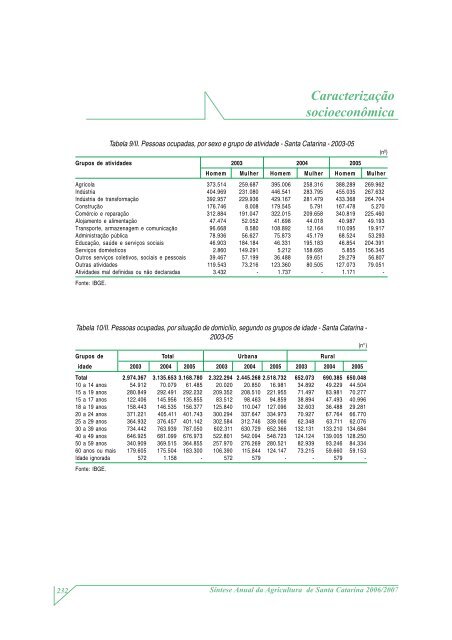
Caracterização<br />
socioeconômica<br />
Tabela 9/II. Pessoas ocupa<strong>da</strong>s, por sexo e grupo <strong>de</strong> ativi<strong>da</strong><strong>de</strong> - <strong>Santa</strong> <strong>Catarina</strong> - 2003-05<br />
Grupos <strong>de</strong> ativi<strong>da</strong><strong>de</strong>s 2003 2004 2005<br />
Homem Mulher Homem Mulher Homem Mulher<br />
Agrícola 373.514 259.687 395.006 258.316 388.289 269.962<br />
Indústria 404.969 231.080 446.541 283.795 455.035 267.632<br />
Indústria <strong>de</strong> transformação 392.957 229.936 429.167 281.479 433.368 264.704<br />
Construção 176.746 8.008 179.545 5.791 167.478 5.270<br />
Comércio e reparação 312.884 191.047 322.015 209.658 340.819 225.460<br />
Alojamento e alimentação 47.474 52.052 41.698 44.018 40.987 49.193<br />
Transporte, armazenagem e comunicação 96.668 8.580 108.892 12.164 110.095 19.917<br />
Administração pública 78.936 56.627 75.873 45.179 68.524 53.293<br />
Educação, saú<strong>de</strong> e serviços sociais 46.903 184.184 46.331 195.183 46.854 204.391<br />
Serviços domésticos 2.860 149.291 5.212 158.695 5.855 156.345<br />
Outros serviços coletivos, sociais e pessoais 39.467 57.199 36.488 59.651 29.279 56.807<br />
Outras ativi<strong>da</strong><strong>de</strong>s 119.543 73.216 123.360 80.505 127.073 79.051<br />
Ativi<strong>da</strong><strong>de</strong>s mal <strong>de</strong>fini<strong>da</strong>s ou não <strong>de</strong>clara<strong>da</strong>s 3.432 - 1.737 - 1.171 -<br />
Fonte: IBGE.<br />
(nº)<br />
Tabela 10/II. Pessoas ocupa<strong>da</strong>s, por situação <strong>de</strong> domicílio, segundo os grupos <strong>de</strong> i<strong>da</strong><strong>de</strong> - <strong>Santa</strong> <strong>Catarina</strong> -<br />
2003-05<br />
(n°)<br />
Grupos <strong>de</strong> Total Urbana Rural<br />
i<strong>da</strong><strong>de</strong> 2003 2004 2005 2003 2004 2005 2003 2004 2005<br />
Total 2.974.367 3.135.653 3.168.780 2.322.294 2.445.268 2.518.732 652.073 690.385 650.048<br />
10 a 14 anos 54.912 70.079 61.485 20.020 20.850 16.981 34.892 49.229 44.504<br />
15 a 19 anos 280.849 292.491 292.232 209.352 208.510 221.955 71.497 83.981 70.277<br />
15 a 17 anos 122.406 145.956 135.855 83.512 98.463 94.859 38.894 47.493 40.996<br />
18 a 19 anos 158.443 146.535 156.377 125.840 110.047 127.096 32.603 36.488 29.281<br />
20 a 24 anos 371.221 405.411 401.743 300.294 337.647 334.973 70.927 67.764 66.770<br />
25 a 29 anos 364.932 376.457 401.142 302.584 312.746 339.066 62.348 63.711 62.076<br />
30 a 39 anos 734.442 763.939 787.050 602.311 630.729 652.366 132.131 133.210 134.684<br />
40 a 49 anos 646.925 681.099 676.973 522.801 542.094 548.723 124.124 139.005 128.250<br />
50 a 59 anos 340.909 369.515 364.855 257.970 276.269 280.521 82.939 93.246 84.334<br />
60 anos ou mais 179.605 175.504 183.300 106.390 115.844 124.147 73.215 59.660 59.153<br />
I<strong>da</strong><strong>de</strong> ignora<strong>da</strong> 572 1.158 - 572 579 - - 579 -<br />
Fonte: IBGE.<br />
232<br />
Síntese <strong>Anual</strong> <strong>da</strong> <strong>Agricultura</strong> <strong>de</strong> <strong>Santa</strong> <strong>Catarina</strong> <strong>2006</strong>/<strong>2007</strong>


