

SÃntese Anual da Agricultura de Santa Catarina - 2006-2007 - Cepa
SÃntese Anual da Agricultura de Santa Catarina - 2006-2007 - Cepa
SÃntese Anual da Agricultura de Santa Catarina - 2006-2007 - Cepa

You also want an ePaper? Increase the reach of your titles
YUMPU automatically turns print PDFs into web optimized ePapers that Google loves.
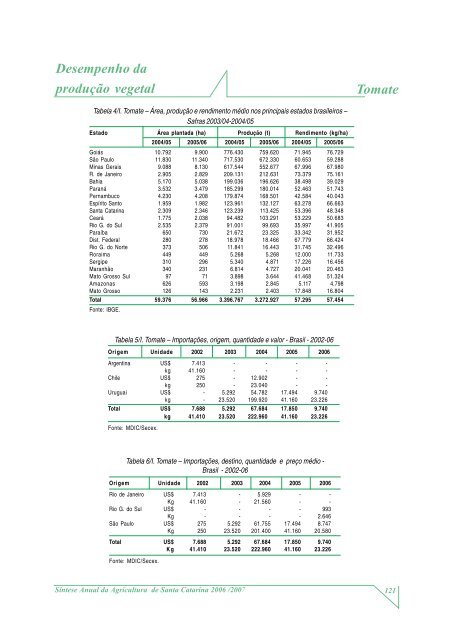
Desempenho <strong>da</strong><br />
produção vegetal<br />
Tomate<br />
Tabela 4/I. Tomate – Área, produção e rendimento médio nos principais estados brasileiros –<br />
Safras 2003/04-2004/05<br />
Estado Área planta<strong>da</strong> (ha) Produção (t) Rendimento (kg/ha)<br />
2004/05 2005/06 2004/05 2005/06 2004/05 2005/06<br />
Goiás 10.792 9.900 776.430 759.620 71.945 76.729<br />
São Paulo 11.830 11.340 717.530 672.330 60.653 59.288<br />
Minas Gerais 9.088 8.130 617.544 552.677 67.996 67.980<br />
R. <strong>de</strong> Janeiro 2.905 2.829 209.131 212.631 73.379 75.161<br />
Bahia 5.170 5.038 199.036 196.626 38.498 39.029<br />
Paraná 3.532 3.479 185.299 180.014 52.463 51.743<br />
Pernambuco 4.230 4.208 179.874 168.501 42.584 40.043<br />
Espírito Santo 1.959 1.982 123.961 132.127 63.278 66.663<br />
<strong>Santa</strong> <strong>Catarina</strong> 2.309 2.346 123.239 113.425 53.396 48.348<br />
Ceará 1.775 2.038 94.482 103.291 53.229 50.683<br />
Rio G. do Sul 2.535 2.379 91.001 99.693 35.997 41.905<br />
Paraíba 650 730 21.672 23.325 33.342 31.952<br />
Dist. Fe<strong>de</strong>ral 280 278 18.978 18.466 67.779 66.424<br />
Rio G. do Norte 373 506 11.841 16.443 31.745 32.496<br />
Roraima 449 449 5.268 5.268 12.000 11.733<br />
Sergipe 310 296 5.340 4.871 17.226 16.456<br />
Maranhão 340 231 6.814 4.727 20.041 20.463<br />
Mato Grosso Sul 97 71 3.898 3.644 41.468 51.324<br />
Amazonas 626 593 3.198 2.845 5.117 4.798<br />
Mato Grosso 126 143 2.231 2.403 17.848 16.804<br />
Total 59.376 56.966 3.396.767 3.272.927 57.295 57.454<br />
Fonte: IBGE.<br />
Tabela 5/I. Tomate – Importações, origem, quanti<strong>da</strong><strong>de</strong> e valor - Brasil - 2002-06<br />
Origem Uni<strong>da</strong><strong>de</strong> 2002 2003 2004 2005 <strong>2006</strong><br />
Argentina US$ 7.413 - - - -<br />
kg 41.160 - - - -<br />
Chile US$ 275 - 12.902 - -<br />
kg 250 - 23.040 - -<br />
Uruguai US$ - 5.292 54.782 17.494 9.740<br />
kg - 23.520 199.920 41.160 23.226<br />
Total US$ 7.688 5.292 67.684 17.850 9.740<br />
kg 41.410 23.520 222.960 41.160 23.226<br />
Fonte: MDIC/Secex.<br />
Tabela 6/I. Tomate – Importações, <strong>de</strong>stino, quanti<strong>da</strong><strong>de</strong> e preço médio -<br />
Brasil - 2002-06<br />
Origem Uni<strong>da</strong><strong>de</strong> 2002 2003 2004 2005 <strong>2006</strong><br />
Rio <strong>de</strong> Janeiro US$ 7.413 - 5.929 - -<br />
Kg 41.160 - 21.560 - -<br />
Rio G. do Sul US$ - - - - 993<br />
Kg - - - - 2.646<br />
São Paulo US$ 275 5.292 61.755 17.494 8.747<br />
Kg 250 23.520 201.400 41.160 20.580<br />
Total US$ 7.688 5.292 67.684 17.850 9.740<br />
Kg 41.410 23.520 222.960 41.160 23.226<br />
Fonte: MDIC/Secex.<br />
Síntese <strong>Anual</strong> <strong>da</strong> <strong>Agricultura</strong> <strong>de</strong> <strong>Santa</strong> <strong>Catarina</strong> <strong>2006</strong> /<strong>2007</strong><br />
121


