

SÃntese Anual da Agricultura de Santa Catarina - 2006-2007 - Cepa
SÃntese Anual da Agricultura de Santa Catarina - 2006-2007 - Cepa
SÃntese Anual da Agricultura de Santa Catarina - 2006-2007 - Cepa

Create successful ePaper yourself
Turn your PDF publications into a flip-book with our unique Google optimized e-Paper software.
Desempenho <strong>da</strong><br />
produção animal<br />
Carne suína<br />
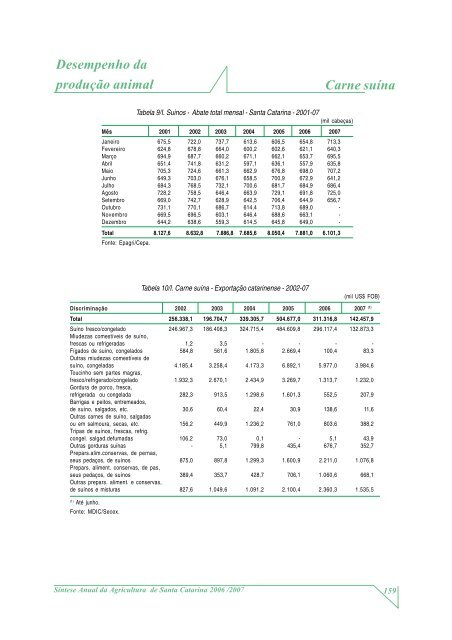
Tabela 9/I. Suinos - Abate total mensal - <strong>Santa</strong> <strong>Catarina</strong> - 2001-07<br />
(mil cabeças)<br />
Mês 2001 2002 2003 2004 2005 <strong>2006</strong> <strong>2007</strong><br />
Janeiro 675,5 722,0 737,7 613,6 606,5 654,8 713,3<br />
Fevereiro 624,8 678,8 664,0 600,2 602,6 621,1 640,3<br />
Março 694,9 687,7 660,2 671,1 662,1 653,7 695,5<br />
Abril 651,4 741,8 631,2 597,1 636,1 557,9 635,8<br />
Maio 705,3 724,6 661,3 662,9 676,8 698,0 707,2<br />
Junho 649,3 703,0 676,1 658,5 700,9 672,9 641,2<br />
Julho 684,3 768,5 732,1 700,6 681,7 684,9 686,4<br />
Agosto 728,2 758,5 646,4 663,9 729,1 691,8 725,0<br />
Setembro 669,0 742,7 628,9 642,5 706,4 644,9 656,7<br />
Outubro 731,1 770,1 686,7 614,4 713,8 689,0 -<br />
Novembro 669,5 696,5 603,1 646,4 688,6 663,1 -<br />
Dezembro 644,2 638,6 559,3 614,5 645,8 649,0 -<br />
Total 8.127,6 8.632,8 7.886,8 7.685,6 8.050,4 7.881,0 6.101,3<br />
Fonte: Epagri/<strong>Cepa</strong>.<br />
Tabela 10/I. Carne suína - Exportação catarinense - 2002-07<br />
(mil US$ FOB)<br />
Discriminação 2002 2003 2004 2005 <strong>2006</strong> <strong>2007</strong> (1)<br />
Total 256.338,1 196.704,7 339.305,7 504.677,0 311.316,8 142.457,9<br />
Suíno fresco/congelado 246.967,3 186.408,3 324.715,4 484.609,8 296.117,4 132.873,3<br />
Miu<strong>de</strong>zas comestíveis <strong>de</strong> suíno,<br />
frescas ou refrigera<strong>da</strong>s 1,2 3,5 - - - -<br />
Fígados <strong>de</strong> suíno, congelados 584,8 561,6 1.805,8 2.669,4 100,4 83,3<br />
Outras miu<strong>de</strong>zas comestíveis <strong>de</strong><br />
suíno, congela<strong>da</strong>s 4.185,4 3.258,4 4.173,3 6.892,1 5.977,0 3.984,6<br />
Toucinho sem partes magras,<br />
fresco/refrigerado/congelado 1.932,3 2.670,1 2.434,9 3.269,7 1.313,7 1.232,0<br />
Gordura <strong>de</strong> porco, fresca,<br />
refrigera<strong>da</strong> ou congela<strong>da</strong> 282,3 913,5 1.298,6 1.601,3 552,5 207,9<br />
Barrigas e peitos, entremeados,<br />
<strong>de</strong> suíno, salgados, etc. 30,6 60,4 22,4 30,9 138,6 11,6<br />
Outras carnes <strong>de</strong> suíno, salga<strong>da</strong>s<br />
ou em salmoura, secas, etc. 156,2 449,9 1.236,2 761,0 803,6 388,2<br />
Tripas <strong>de</strong> suínos, frescas, refrig.<br />
congel. salgad.<strong>de</strong>fuma<strong>da</strong>s 106,2 73,0 0,1 - 5,1 43,9<br />
Outras gorduras suínas - 5,1 799,8 435,4 676,7 352,7<br />
Prepars.alim.conservas, <strong>de</strong> pernas,<br />
seus pe<strong>da</strong>ços, <strong>de</strong> suínos 875,0 897,8 1.299,3 1.600,9 2.211,0 1.076,8<br />
Prepars. aliment. conservas, <strong>de</strong> pas,<br />
seus pe<strong>da</strong>ços, <strong>de</strong> suínos 389,4 353,7 428,7 706,1 1.060,6 668,1<br />
Outras prepars. aliment. e conservas,<br />
<strong>de</strong> suínos e misturas 827,6 1.049,6 1.091,2 2.100,4 2.360,3 1.535,5<br />
(1)<br />
Até junho.<br />
Fonte: MDIC/Secex.<br />
Síntese <strong>Anual</strong> <strong>da</strong> <strong>Agricultura</strong> <strong>de</strong> <strong>Santa</strong> <strong>Catarina</strong> <strong>2006</strong> /<strong>2007</strong><br />
159


