

SÃntese Anual da Agricultura de Santa Catarina - 2006-2007 - Cepa
SÃntese Anual da Agricultura de Santa Catarina - 2006-2007 - Cepa
SÃntese Anual da Agricultura de Santa Catarina - 2006-2007 - Cepa

You also want an ePaper? Increase the reach of your titles
YUMPU automatically turns print PDFs into web optimized ePapers that Google loves.
Desempenho <strong>da</strong><br />
Fumo<br />
produção vegetal<br />
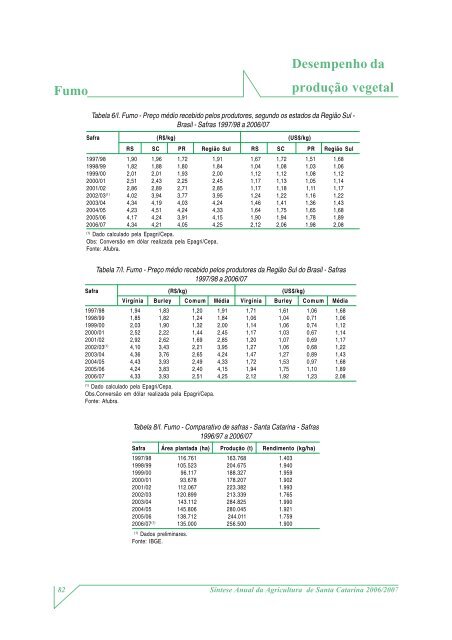
Tabela 6/I. Fumo - Preço médio recebido pelos produtores, segundo os estados <strong>da</strong> Região Sul -<br />
Brasil - Safras 1997/98 a <strong>2006</strong>/07<br />
Safra (R$/kg) (US$/kg)<br />
RS SC PR Região Sul RS SC PR Região Sul<br />
1997/98 1,90 1,96 1,72 1,91 1,67 1,72 1,51 1,68<br />
1998/99 1,82 1,88 1,80 1,84 1,04 1,08 1,03 1,06<br />
1999/00 2,01 2,01 1,93 2,00 1,12 1,12 1,08 1,12<br />
2000/01 2,51 2,43 2,25 2,45 1,17 1,13 1,05 1,14<br />
2001/02 2,86 2,89 2,71 2,85 1,17 1,18 1,11 1,17<br />
2002/03 (1) 4,02 3,94 3,77 3,95 1,24 1,22 1,16 1,22<br />
2003/04 4,34 4,19 4,03 4,24 1,46 1,41 1,36 1,43<br />
2004/05 4,23 4,51 4,24 4,33 1,64 1,75 1,65 1,68<br />
2005/06 4,17 4,24 3,91 4,15 1,90 1,94 1,78 1,89<br />
<strong>2006</strong>/07 4,34 4,21 4,05 4,25 2,12 2,06 1,98 2,08<br />
(1)<br />
Dado calculado pela Epagri/<strong>Cepa</strong>.<br />
Obs: Conversão em dólar realiza<strong>da</strong> pela Epagri/<strong>Cepa</strong>.<br />
Fonte: Afubra.<br />
Tabela 7/I. Fumo - Preço médio recebido pelos produtores <strong>da</strong> Região Sul do Brasil - Safras<br />
1997/98 a <strong>2006</strong>/07<br />
Safra (R$/kg) (US$/kg)<br />
Virgínia Burley Comum Média Virgínia Burley Comum Média<br />
1997/98 1,94 1,83 1,20 1,91 1,71 1,61 1,06 1,68<br />
1998/99 1,85 1,82 1,24 1,84 1,06 1,04 0,71 1,06<br />
1999/00 2,03 1,90 1,32 2,00 1,14 1,06 0,74 1,12<br />
2000/01 2,52 2,22 1,44 2,45 1,17 1,03 0,67 1,14<br />
2001/02 2,92 2,62 1,69 2,85 1,20 1,07 0,69 1,17<br />
2002/03 (1) 4,10 3,43 2,21 3,95 1,27 1,06 0,68 1,22<br />
2003/04 4,36 3,76 2,65 4,24 1,47 1,27 0,89 1,43<br />
2004/05 4,43 3,93 2,49 4,33 1,72 1,53 0,97 1,68<br />
2005/06 4,24 3,83 2,40 4,15 1,94 1,75 1,10 1,89<br />
<strong>2006</strong>/07 4,33 3,93 2,51 4,25 2,12 1,92 1,23 2,08<br />
(1)<br />
Dado calculado pela Epagri/<strong>Cepa</strong>.<br />
Obs.Conversão em dólar realiza<strong>da</strong> pela Epagri/<strong>Cepa</strong>.<br />
Fonte: Afubra.<br />
Tabela 8/I. Fumo - Comparativo <strong>de</strong> safras - <strong>Santa</strong> <strong>Catarina</strong> - Safras<br />
1996/97 a <strong>2006</strong>/07<br />
Safra Área planta<strong>da</strong> (ha) Produção (t) Rendimento (kg/ha)<br />
1997/98 116.761 163.768 1.403<br />
1998/99 105.523 204.675 1.940<br />
1999/00 96.117 188.327 1.959<br />
2000/01 93.678 178.207 1.902<br />
2001/02 112.067 223.382 1.993<br />
2002/03 120.899 213.339 1.765<br />
2003/04 143.112 284.825 1.990<br />
2004/05 145.806 280.045 1.921<br />
2005/06 138.712 244.011 1.759<br />
<strong>2006</strong>/07 (1) 135.000 256.500 1.900<br />
(1)<br />
Dados preliminares.<br />
Fonte: IBGE.<br />
82<br />
Síntese <strong>Anual</strong> <strong>da</strong> <strong>Agricultura</strong> <strong>de</strong> <strong>Santa</strong> <strong>Catarina</strong> <strong>2006</strong>/<strong>2007</strong>


