

SÃntese Anual da Agricultura de Santa Catarina - 2006-2007 - Cepa
SÃntese Anual da Agricultura de Santa Catarina - 2006-2007 - Cepa
SÃntese Anual da Agricultura de Santa Catarina - 2006-2007 - Cepa

You also want an ePaper? Increase the reach of your titles
YUMPU automatically turns print PDFs into web optimized ePapers that Google loves.
Desempenho <strong>da</strong> economia<br />
mundial e brasileira e <strong>da</strong><br />
comercialização internacional<br />
<strong>de</strong> produtos do agronegócio<br />
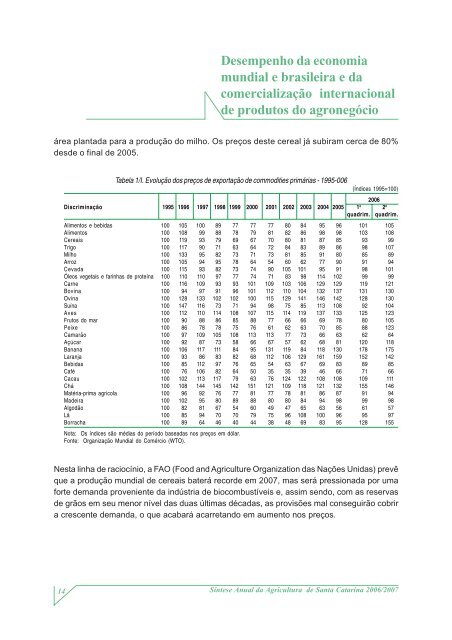
área planta<strong>da</strong> para a produção do milho. Os preços <strong>de</strong>ste cereal já subiram cerca <strong>de</strong> 80%<br />
<strong>de</strong>s<strong>de</strong> o final <strong>de</strong> 2005.<br />
Tabela 1/I. Evolução dos preços <strong>de</strong> exportação <strong>de</strong> commodities primárias - 1995-006<br />
(Índices 1995=100)<br />
<strong>2006</strong><br />
Discriminação 1995 1996 1997 1998 1999 2000 2001 2002 2003 2004 2005 1 o 2 o<br />
quadrim. quadrim.<br />
Alimentos e bebi<strong>da</strong>s 100 105 100 89 77 77 77 80 84 95 96 101 105<br />
Alimentos 100 108 99 88 78 79 81 82 86 98 98 103 108<br />
Cereais 100 119 93 79 69 67 70 80 81 87 85 93 99<br />
Trigo 100 117 90 71 63 64 72 84 83 89 86 98 107<br />
Milho 100 133 95 82 73 71 73 81 85 91 80 85 89<br />
Arroz 100 105 94 95 78 64 54 60 62 77 90 91 94<br />
Ceva<strong>da</strong> 100 115 93 82 73 74 90 105 101 95 91 98 101<br />
Óleos vegetais e farinhas <strong>de</strong> proteína 100 110 110 97 77 74 71 83 98 114 102 99 99<br />
Carne 100 116 109 93 93 101 109 103 106 129 129 119 121<br />
Bovina 100 94 97 91 96 101 112 110 104 132 137 131 130<br />
Ovina 100 128 133 102 102 100 115 129 141 146 142 128 130<br />
Suína 100 147 116 73 71 94 98 75 85 113 108 92 104<br />
Aves 100 112 110 114 108 107 115 114 119 137 133 125 123<br />
Frutos do mar 100 90 88 86 85 88 77 66 66 69 78 80 105<br />
Peixe 100 86 78 78 75 76 61 62 63 70 85 88 123<br />
Camarão 100 97 109 105 108 113 113 77 73 66 63 62 64<br />
Açúcar 100 92 87 73 58 66 67 57 62 68 81 120 118<br />
Banana 100 106 117 111 84 95 131 119 84 118 130 178 175<br />
Laranja 100 93 86 83 82 68 112 106 129 161 159 152 142<br />
Bebi<strong>da</strong>s 100 85 112 97 76 65 54 63 67 69 83 89 85<br />
Café 100 76 106 82 64 50 35 35 39 46 66 71 66<br />
Cacau 100 102 113 117 79 63 76 124 122 108 108 109 111<br />
Chá 100 108 144 145 142 151 121 109 118 121 132 155 146<br />
Matéria-prima agrícola 100 96 92 76 77 81 77 78 81 86 87 91 94<br />
Ma<strong>de</strong>ira 100 102 95 80 89 88 80 80 84 94 98 99 98<br />
Algodão 100 82 81 67 54 60 49 47 65 63 56 61 57<br />
Lã 100 85 94 70 70 79 75 96 108 100 96 95 97<br />
Borracha 100 89 64 46 40 44 38 48 69 83 95 128 155<br />
Nota: Os índices são médias do período basea<strong>da</strong>s nos preços em dólar.<br />
Fonte: Organização Mundial do Comércio (WTO).<br />
Nesta linha <strong>de</strong> raciocínio, a FAO (Food and Agriculture Organization <strong>da</strong>s Nações Uni<strong>da</strong>s) prevê<br />
que a produção mundial <strong>de</strong> cereais baterá recor<strong>de</strong> em <strong>2007</strong>, mas será pressiona<strong>da</strong> por uma<br />
forte <strong>de</strong>man<strong>da</strong> proveniente <strong>da</strong> indústria <strong>de</strong> biocombustíveis e, assim sendo, com as reservas<br />
<strong>de</strong> grãos em seu menor nível <strong>da</strong>s duas últimas déca<strong>da</strong>s, as provisões mal conseguirão cobrir<br />
a crescente <strong>de</strong>man<strong>da</strong>, o que acabará acarretando em aumento nos preços.<br />
14<br />
Síntese <strong>Anual</strong> <strong>da</strong> <strong>Agricultura</strong> <strong>de</strong> <strong>Santa</strong> <strong>Catarina</strong> <strong>2006</strong>/<strong>2007</strong>


