

SÃntese Anual da Agricultura de Santa Catarina - 2006-2007 - Cepa
SÃntese Anual da Agricultura de Santa Catarina - 2006-2007 - Cepa
SÃntese Anual da Agricultura de Santa Catarina - 2006-2007 - Cepa

Create successful ePaper yourself
Turn your PDF publications into a flip-book with our unique Google optimized e-Paper software.
Carne suína<br />
Desempenho <strong>da</strong><br />
produção animal<br />
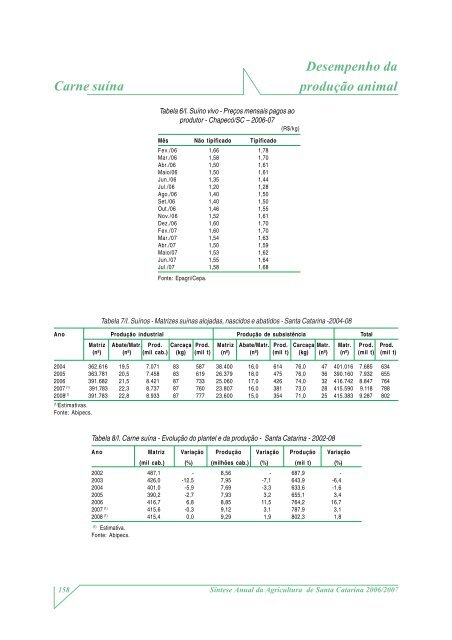
Tabela 6/I. Suíno vivo - Preços mensais pagos ao<br />
produtor - Chapecó/SC – <strong>2006</strong>-07<br />
(R$/kg)<br />
Mês Não tipificado Tipificado<br />
Fev./06 1,66 1,78<br />
Mar./06 1,58 1,70<br />
Abr./06 1,50 1,61<br />
Maio/06 1,50 1,61<br />
Jun./06 1,35 1,44<br />
Jul./06 1,20 1,28<br />
Ago./06 1,40 1,50<br />
Set./06 1,40 1,50<br />
Out./06 1,46 1,55<br />
Nov./06 1,52 1,61<br />
Dez./06 1,60 1,70<br />
Fev./07 1,60 1,70<br />
Mar./07 1,54 1,63<br />
Abr./07 1,50 1,59<br />
Maio/07 1,53 1,62<br />
Jun./07 1,55 1,64<br />
Jul./07 1,58 1,68<br />
Fonte: Epagri/<strong>Cepa</strong>.<br />
Tabela 7/I. Suínos - Matrizes suínas aloja<strong>da</strong>s, nascidos e abatidos - <strong>Santa</strong> <strong>Catarina</strong> -2004-08<br />
Ano Produção industrial Produção <strong>de</strong> subsistência Total<br />
Matriz Abate/Matr. Prod. Carcaça Prod. Matriz Abate/Matr. Prod. Carcaça Matr. Matr. Prod. Prod.<br />
(nº) (nº) (mil cab.) (kg) (mil t) (nº) (nº) (mil t) (kg) (nº) (nº) (mil t) (mil t)<br />
2004 362.616 19,5 7.071 83 587 38.400 16,0 614 76,0 47 401.016 7.685 634<br />
2005 363.781 20,5 7.458 83 619 26.379 18,0 475 76,0 36 390.160 7.932 655<br />
<strong>2006</strong> 391.682 21,5 8.421 87 733 25.060 17,0 426 74,0 32 416.742 8.847 764<br />
<strong>2007</strong> (1) 391.783 22,3 8.737 87 760 23.807 16,0 381 73,0 28 415.590 9.118 788<br />
2008 (1) 391.783 22,8 8.933 87 777 23.600 15,0 354 71,0 25 415.383 9.287 802<br />
(1)<br />
Estimativas.<br />
Fonte: Abipecs.<br />
Tabela 8/I. Carne suína - Evolução do plantel e <strong>da</strong> produção - <strong>Santa</strong> <strong>Catarina</strong> - 2002-08<br />
Ano Matriz Variação Produção Variação Produção Variação<br />
2002 487,1 - 8,56 - 687,9 -<br />
2003 426,0 -12,5 7,95 -7,1 643,9 -6,4<br />
2004 401,0 -5,9 7,69 -3,3 633,6 -1,6<br />
2005 390,2 -2,7 7,93 3,2 655,1 3,4<br />
<strong>2006</strong> 416,7 6,8 8,85 11,5 764,2 16,7<br />
<strong>2007</strong> (1) 415,6 -0,3 9,12 3,1 787,9 3,1<br />
2008 (1) 415,4 0,0 9,29 1,9 802,3 1,8<br />
(1)<br />
Estimativa.<br />
Fonte: Abipecs.<br />
(mil cab.) (%) (milhões cab.) (%) (mil t) (%)<br />
158<br />
Síntese <strong>Anual</strong> <strong>da</strong> <strong>Agricultura</strong> <strong>de</strong> <strong>Santa</strong> <strong>Catarina</strong> <strong>2006</strong>/<strong>2007</strong>


