

SÃntese Anual da Agricultura de Santa Catarina - 2006-2007 - Cepa
SÃntese Anual da Agricultura de Santa Catarina - 2006-2007 - Cepa
SÃntese Anual da Agricultura de Santa Catarina - 2006-2007 - Cepa

Create successful ePaper yourself
Turn your PDF publications into a flip-book with our unique Google optimized e-Paper software.
Desempenho <strong>da</strong><br />
produção vegetal<br />
Banana<br />
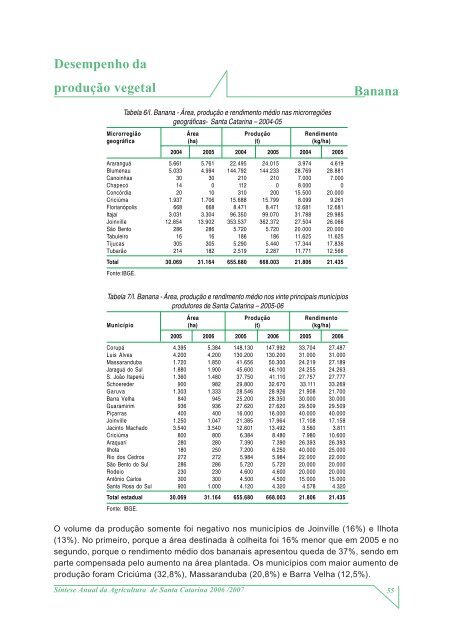
Tabela 6/I. Banana - Área, produção e rendimento médio nas microrregiões<br />
geográficas- <strong>Santa</strong> <strong>Catarina</strong> – 2004-05<br />
Microrregião Área Produção Rendimento<br />
geográfica (ha) (t) (kg/ha)<br />
2004 2005 2004 2005 2004 2005<br />
Araranguá 5.661 5.761 22.495 24.015 3.974 4.619<br />
Blumenau 5.033 4.994 144.792 144.233 28.769 28.881<br />
Canoinhas 30 30 210 210 7.000 7.000<br />
Chapecó 14 0 112 0 8.000 0<br />
Concórdia 20 10 310 200 15.500 20.000<br />
Criciúma 1.937 1.706 15.688 15.799 8.099 9.261<br />
Florianópolis 668 668 8.471 8.471 12.681 12.681<br />
Itajaí 3.031 3.304 96.350 99.070 31.788 29.985<br />
Joinville 12.854 13.902 353.537 362.372 27.504 26.066<br />
São Bento 286 286 5.720 5.720 20.000 20.000<br />
Tabuleiro 16 16 186 186 11.625 11.625<br />
Tijucas 305 305 5.290 5.440 17.344 17.836<br />
Tubarão 214 182 2.519 2.287 11.771 12.566<br />
Total 30.069 31.164 655.680 668.003 21.806 21.435<br />
Fonte:IBGE.<br />
Tabela 7/I. Banana - Área, produção e rendimento médio nos vinte principais municípios<br />
produtores <strong>de</strong> <strong>Santa</strong> <strong>Catarina</strong> – 2005-06<br />
Área Produção Rendimento<br />
Município (ha) (t) (kg/ha)<br />
2005 <strong>2006</strong> 2005 <strong>2006</strong> 2005 <strong>2006</strong><br />
Corupá 4.395 5.384 148.130 147.992 33.704 27.487<br />
Luis Alves 4.200 4.200 130.200 130.200 31.000 31.000<br />
Massaranduba 1.720 1.850 41.656 50.300 24.219 27.189<br />
Jaraguá do Sul 1.880 1.900 45.600 46.100 24.255 24.263<br />
S. João Itaperiú 1.360 1.480 37.750 41.110 27.757 27.777<br />
Schoere<strong>de</strong>r 900 982 29.800 32.670 33.111 33.269<br />
Garuva 1.303 1.333 28.546 28.926 21.908 21.700<br />
Barra Velha 840 945 25.200 28.350 30.000 30.000<br />
Guaramirim 936 936 27.620 27.620 29.509 29.509<br />
Piçarras 400 400 16.000 16.000 40.000 40.000<br />
Joinville 1.250 1.047 21.385 17.964 17.108 17.158<br />
Jacinto Machado 3.540 3.540 12.601 13.492 3.560 3.811<br />
Criciúma 800 800 6.384 8.480 7.980 10.600<br />
Araquarí 280 280 7.390 7.390 26.393 26.393<br />
Ilhota 180 250 7.200 6.250 40.000 25.000<br />
Rio dos Cedros 272 272 5.984 5.984 22.000 22.000<br />
São Bento do Sul 286 286 5.720 5.720 20.000 20.000<br />
Ro<strong>de</strong>io 230 230 4.600 4.600 20.000 20.000<br />
Antônio Carlos 300 300 4.500 4.500 15.000 15.000<br />
<strong>Santa</strong> Rosa do Sul 900 1.000 4.120 4.320 4.578 4.320<br />
Total estadual 30.069 31.164 655.680 668.003 21.806 21.435<br />
Fonte: IBGE.<br />
O volume <strong>da</strong> produção somente foi negativo nos municípios <strong>de</strong> Joinville (16%) e Ilhota<br />
(13%). No primeiro, porque a área <strong>de</strong>stina<strong>da</strong> à colheita foi 16% menor que em 2005 e no<br />
segundo, porque o rendimento médio dos bananais apresentou que<strong>da</strong> <strong>de</strong> 37%, sendo em<br />
parte compensa<strong>da</strong> pelo aumento na área planta<strong>da</strong>. Os municípios com maior aumento <strong>de</strong><br />
produção foram Criciúma (32,8%), Massaranduba (20,8%) e Barra Velha (12,5%).<br />
Síntese <strong>Anual</strong> <strong>da</strong> <strong>Agricultura</strong> <strong>de</strong> <strong>Santa</strong> <strong>Catarina</strong> <strong>2006</strong> /<strong>2007</strong> 55


