

SÃntese Anual da Agricultura de Santa Catarina - 2006-2007 - Cepa
SÃntese Anual da Agricultura de Santa Catarina - 2006-2007 - Cepa
SÃntese Anual da Agricultura de Santa Catarina - 2006-2007 - Cepa

You also want an ePaper? Increase the reach of your titles
YUMPU automatically turns print PDFs into web optimized ePapers that Google loves.
Informações econômicas<br />
<strong>da</strong> agropecuária<br />
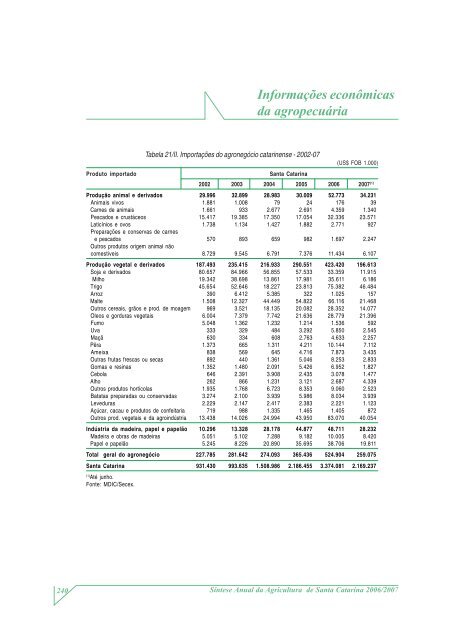
Tabela 21/II. Importações do agronegócio catarinense - 2002-07<br />
(US$ FOB 1.000)<br />
Produto importado<br />
<strong>Santa</strong> <strong>Catarina</strong><br />
2002 2003 2004 2005 <strong>2006</strong> <strong>2007</strong> (1)<br />
Produção animal e <strong>de</strong>rivados 29.996 32.899 28.983 30.009 52.773 34.231<br />
Animais vivos 1.881 1.008 79 24 176 39<br />
Carnes <strong>de</strong> animais 1.661 933 2.677 2.691 4.359 1.340<br />
Pescados e crustáceos 15.417 19.385 17.350 17.054 32.336 23.571<br />
Laticínios e ovos 1.738 1.134 1.427 1.882 2.771 927<br />
Preparações e conservas <strong>de</strong> carnes<br />
e pescados 570 893 659 982 1.697 2.247<br />
Outros produtos origem animal não<br />
comestiveis 8.729 9.545 6.791 7.376 11.434 6.107<br />
Produção vegetal e <strong>de</strong>rivados 187.493 235.415 216.933 290.551 423.420 196.613<br />
Soja e <strong>de</strong>rivados 80.657 84.966 56.855 57.533 33.359 11.915<br />
Milho 19.342 38.698 13.861 17.981 35.611 6.186<br />
Trigo 45.654 52.646 18.227 23.813 75.382 46.484<br />
Arroz 390 6.412 5.385 322 1.025 157<br />
Malte 1.508 12.327 44.449 54.822 66.116 21.468<br />
Outros cereais, grãos e prod. <strong>de</strong> moagem 969 3.521 18.135 20.082 28.352 14.077<br />
Oleos e gorduras vegetais 6.004 7.379 7.742 21.636 28.779 21.396<br />
Fumo 5.048 1.362 1.232 1.214 1.536 592<br />
Uva 333 329 484 3.292 5.850 2.545<br />
Maçã 630 334 608 2.763 4.633 2.257<br />
Pêra 1.373 665 1.311 4.211 10.144 7.112<br />
Ameixa 838 569 645 4.716 7.873 3.435<br />
Outras frutas frescas ou secas 892 440 1.361 5.046 8.253 2.833<br />
Gomas e resinas 1.352 1.480 2.091 5.426 6.952 1.827<br />
Cebola 646 2.391 3.908 2.435 3.078 1.477<br />
Alho 262 866 1.231 3.121 2.687 4.339<br />
Outros produtos hortícolas 1.935 1.768 6.723 8.353 9.060 2.523<br />
Batatas prepara<strong>da</strong>s ou conserva<strong>da</strong>s 3.274 2.100 3.939 5.986 8.034 3.939<br />
Leveduras 2.229 2.147 2.417 2.383 2.221 1.123<br />
Açúcar, cacau e produtos <strong>de</strong> confeitaria 719 988 1.335 1.465 1.405 872<br />
Outros prod. vegetais e <strong>da</strong> agroindústria 13.438 14.026 24.994 43.950 83.070 40.054<br />
Indústria <strong>da</strong> ma<strong>de</strong>ira, papel e papelão 10.296 13.328 28.178 44.877 48.711 28.232<br />
Ma<strong>de</strong>ira e obras <strong>de</strong> ma<strong>de</strong>iras 5.051 5.102 7.288 9.182 10.005 8.420<br />
Papel e papelão 5.245 8.226 20.890 35.695 38.706 19.811<br />
Total geral do agronegócio 227.785 281.642 274.093 365.436 524.904 259.075<br />
<strong>Santa</strong> <strong>Catarina</strong> 931.430 993.635 1.508.986 2.186.455 3.374.081 2.169.237<br />
(1)<br />
Até junho.<br />
Fonte: MDIC/Secex.<br />
240<br />
Síntese <strong>Anual</strong> <strong>da</strong> <strong>Agricultura</strong> <strong>de</strong> <strong>Santa</strong> <strong>Catarina</strong> <strong>2006</strong>/<strong>2007</strong>


