

SÃntese Anual da Agricultura de Santa Catarina - 2006-2007 - Cepa
SÃntese Anual da Agricultura de Santa Catarina - 2006-2007 - Cepa
SÃntese Anual da Agricultura de Santa Catarina - 2006-2007 - Cepa

Create successful ePaper yourself
Turn your PDF publications into a flip-book with our unique Google optimized e-Paper software.
Informações econômicas<br />
<strong>da</strong> agropecuária<br />
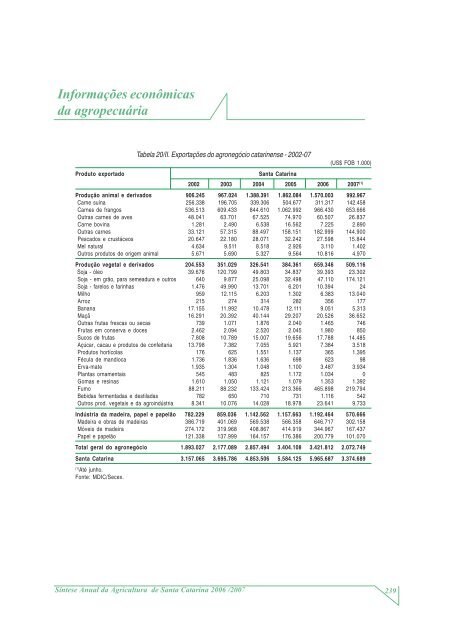
Tabela 20/II. Exportações do agronegócio catarinense - 2002-07<br />
(US$ FOB 1.000)<br />
Produto exportado<br />
<strong>Santa</strong> <strong>Catarina</strong><br />
2002 2003 2004 2005 <strong>2006</strong> <strong>2007</strong> (1)<br />
Produção animal e <strong>de</strong>rivados 906.245 967.024 1.388.391 1.862.084 1.570.003 992.967<br />
Carne suína 256.338 196.705 339.306 504.677 311.317 142.458<br />
Carnes <strong>de</strong> frangos 536.513 609.433 844.610 1.062.992 966.430 653.666<br />
Outras carnes <strong>de</strong> aves 48.041 63.701 67.525 74.970 60.507 26.837<br />
Carne bovina 1.281 2.490 6.538 16.562 7.225 2.890<br />
Outras carnes 33.121 57.315 88.497 158.151 182.999 144.900<br />
Pescados e crustáceos 20.647 22.180 28.071 32.242 27.598 15.844<br />
Mel natural 4.634 9.511 8.518 2.926 3.110 1.402<br />
Outros produtos <strong>de</strong> origem animal 5.671 5.690 5.327 9.564 10.816 4.970<br />
Produção vegetal e <strong>de</strong>rivados 204.553 351.029 326.541 384.361 659.346 509.116<br />
Soja - óleo 39.676 120.799 49.803 34.837 39.393 23.302<br />
Soja - em grão, para semeadura e outros 640 9.877 25.098 32.498 47.110 174.121<br />
Soja - farelos e farinhas 1.476 49.990 13.701 6.201 10.394 24<br />
Milho 959 12.115 6.203 1.302 6.383 13.040<br />
Arroz 215 274 314 282 356 177<br />
Banana 17.155 11.992 10.478 12.111 9.051 5.313<br />
Maçã 16.291 20.392 40.144 29.207 20.526 36.652<br />
Outras frutas frescas ou secas 739 1.071 1.876 2.040 1.465 746<br />
Frutas em conserva e doces 2.462 2.094 2.520 2.045 1.980 850<br />
Sucos <strong>de</strong> frutas 7.808 10.789 15.007 19.656 17.788 14.485<br />
Açúcar, cacau e produtos <strong>de</strong> confeitaria 13.798 7.382 7.055 5.921 7.384 3.518<br />
Produtos hortícolas 176 625 1.551 1.137 365 1.395<br />
Fécula <strong>de</strong> mandioca 1.736 1.836 1.636 698 623 98<br />
Erva-mate 1.935 1.304 1.048 1.100 3.487 3.934<br />
Plantas ornamentais 545 483 825 1.172 1.034 0<br />
Gomas e resinas 1.610 1.050 1.121 1.079 1.353 1.392<br />
Fumo 88.211 88.232 133.424 213.366 465.898 219.794<br />
Bebi<strong>da</strong>s fermenta<strong>da</strong>s e <strong>de</strong>stila<strong>da</strong>s 782 650 710 731 1.116 542<br />
Outros prod. vegetais e <strong>da</strong> agroindústria 8.341 10.076 14.028 18.978 23.641 9.733<br />
Indústria <strong>da</strong> ma<strong>de</strong>ira, papel e papelão 782.229 859.036 1.142.562 1.157.663 1.192.464 570.666<br />
Ma<strong>de</strong>ira e obras <strong>de</strong> ma<strong>de</strong>iras 386.719 401.069 569.538 566.358 646.717 302.158<br />
Móveis <strong>de</strong> ma<strong>de</strong>ira 274.172 319.968 408.867 414.919 344.967 167.437<br />
Papel e papelão 121.338 137.999 164.157 176.386 200.779 101.070<br />
Total geral do agronegócio 1.893.027 2.177.089 2.857.494 3.404.108 3.421.812 2.072.749<br />
<strong>Santa</strong> <strong>Catarina</strong> 3.157.065 3.695.786 4.853.506 5.584.125 5.965.687 3.374.689<br />
(1)<br />
Até junho.<br />
Fonte: MDIC/Secex.<br />
Síntese <strong>Anual</strong> <strong>da</strong> <strong>Agricultura</strong> <strong>de</strong> <strong>Santa</strong> <strong>Catarina</strong> <strong>2006</strong> /<strong>2007</strong> 239


