

SÃntese Anual da Agricultura de Santa Catarina - 2006-2007 - Cepa
SÃntese Anual da Agricultura de Santa Catarina - 2006-2007 - Cepa
SÃntese Anual da Agricultura de Santa Catarina - 2006-2007 - Cepa

Create successful ePaper yourself
Turn your PDF publications into a flip-book with our unique Google optimized e-Paper software.
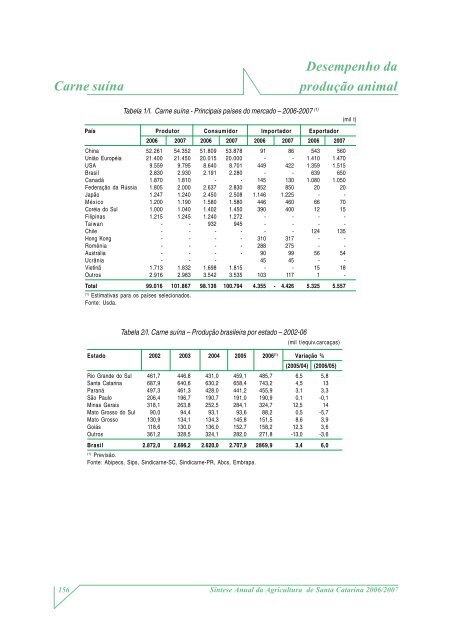
Carne suína<br />
Desempenho <strong>da</strong><br />
produção animal<br />
Tabela 1/I. Carne suína - Principais países do mercado – <strong>2006</strong>-<strong>2007</strong> (1) (mil t)<br />
País Produtor Consumidor Importador Exportador<br />
<strong>2006</strong> <strong>2007</strong> <strong>2006</strong> <strong>2007</strong> <strong>2006</strong> <strong>2007</strong> <strong>2006</strong> <strong>2007</strong><br />
China 52.261 54.352 51.809 53.878 91 86 543 560<br />
União Européia 21.400 21.450 20.015 20.000 - - 1.410 1.470<br />
USA 9.559 9.795 8.640 8.701 449 422 1.359 1.515<br />
Brasil 2.830 2.930 2.191 2.280 - - 639 650<br />
Canadá 1.870 1.810 - - 145 130 1.080 1.050<br />
Fe<strong>de</strong>ração <strong>da</strong> Rússia 1.805 2.000 2.637 2.830 852 850 20 20<br />
Japão 1.247 1.240 2.450 2.508 1.146 1.225 - -<br />
México 1.200 1.190 1.580 1.580 446 460 66 70<br />
Coréia do Sul 1.000 1.040 1.402 1.450 390 400 12 15<br />
Filipinas 1.215 1.245 1.240 1.272 - - - -<br />
Taiwan - - 932 945 - - - -<br />
Chile - - - - - - 124 135<br />
Hong Kong - - - - 310 317 - -<br />
Romênia - - - - 288 275 - -<br />
Austrália - - - - 90 99 56 54<br />
Ucrânia - - - 45 45 - -<br />
Vietinã 1.713 1.832 1.698 1.815 - - 15 18<br />
Outros 2.916 2.983 3.542 3.535 103 117 1 -<br />
Total 99.016 101.867 98.136 100.794 4.355 - 4.426 5.325 5.557<br />
(1)<br />
Estimativas para os países selecionados.<br />
Fonte: Us<strong>da</strong>.<br />
Tabela 2/I. Carne suína – Produção brasileira por estado – 2002-06<br />
(mil t/equiv.carcaças)<br />
Estado 2002 2003 2004 2005 <strong>2006</strong> (1) Variação %<br />
(2005/04) (<strong>2006</strong>/05)<br />
Rio Gran<strong>de</strong> do Sul 461,7 446,8 431,0 459,1 485,7 6,5 5,8<br />
<strong>Santa</strong> <strong>Catarina</strong> 687,9 640,6 630,2 658,4 743,2 4,5 13<br />
Paraná 497,3 461,3 428,0 441,2 455,9 3,1 3,3<br />
São Paulo 206,4 196,7 190,7 191,0 190,9 0,1 -0,1<br />
Minas Gerais 318,1 263,8 252,5 284,1 324,7 12,5 14<br />
Mato Grosso do Sul 90,0 94,4 93,1 93,6 88,2 0,5 -5,7<br />
Mato Grosso 130,9 134,1 134,3 145,8 151,5 8,6 3,9<br />
Goiás 118,6 130,0 136,0 152,7 158,2 12,3 3,6<br />
Outros 361,2 328,5 324,1 282,0 271,8 -13,0 -3,6<br />
Brasil 2.872,0 2.696,2 2.620,0 2.707,9 2869,9 3,4 6,0<br />
(1)<br />
Previsão.<br />
Fonte: Abipecs, Sips, Sindicarne-SC, Sindicarne-PR, Abcs, Embrapa.<br />
156<br />
Síntese <strong>Anual</strong> <strong>da</strong> <strong>Agricultura</strong> <strong>de</strong> <strong>Santa</strong> <strong>Catarina</strong> <strong>2006</strong>/<strong>2007</strong>


