

POVERTY REDUCTION STRATEGY TN

Create successful ePaper yourself
Turn your PDF publications into a flip-book with our unique Google optimized e-Paper software.
Districts<br />
Table 4.7: Health Facilities for Women in Tamil Nadu Districts<br />
Women Receiving 3<br />
or More ANC Visits<br />
During Pregnancy<br />
%<br />
ANCs<br />
3+<br />
Index Value Atleast 2<br />
TT<br />
Injections<br />
Women Receiving<br />
Atleast 2 TT<br />
Injections<br />
Index Value<br />
Complete<br />
Immunisation<br />
Coverage<br />
% Full<br />
Immunisation<br />
Index<br />
Value<br />
Dharmapuri 95.8 0.95515 75.2 0.73136 97.0 0.98146<br />
Ramanathapuram 97.2 0.97086 70.8 0.68203 88.6 0.89660<br />
Ariyalur 93.3 0.92904 84.2 0.83101 97.2 0.98346<br />
Villupuram 89.6 0.89046 89.2 0.88719 87.0 0.88094<br />
Thiruvannamalai 95.2 0.95566 61.8 0.58137 98.8 1.00000<br />
Perambalur 91.4 0.90879 95.1 0.95349 93.6 0.93739<br />
Pudukkottai 98.3 0.98182 58.9 0.54871 96.5 0.97709<br />
Salem 96.9 0.96701 96.8 0.97182 88.1 0.89158<br />
Vellore 96.5 0.96278 77.8 0.75952 92.4 0.93507<br />
Cuddallore 95.4 0.95092 92.9 0.92839 87.1 0.88184<br />
Source: Ranking and mapping of districts, International Institute of Population Sciences (2006), Bombay.<br />
Note: Districts are based on 2001 Census. For all districts in Tamil Nadu, see Appendix Table 4.5.<br />
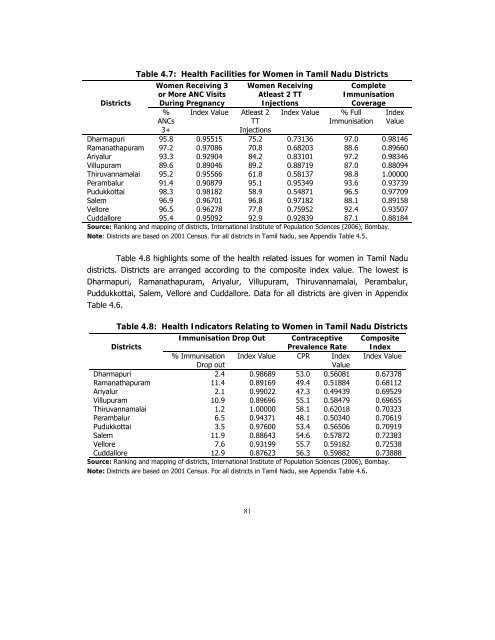
Table 4.8 highlights some of the health related issues for women in Tamil Nadu<br />
districts. Districts are arranged according to the composite index value. The lowest is<br />
Dharmapuri, Ramanathapuram, Ariyalur, Villupuram, Thiruvannamalai, Perambalur,<br />
Puddukkottai, Salem, Vellore and Cuddallore. Data for all districts are given in Appendix<br />
Table 4.6.<br />
Table 4.8: Health Indicators Relating to Women in Tamil Nadu Districts<br />
Immunisation Drop Out Contraceptive Composite<br />
Districts<br />
Prevalence Rate Index<br />
% Immunisation Index Value CPR Index Index Value<br />
Drop out<br />
Value<br />
Dharmapuri 2.4 0.98689 53.0 0.56081 0.67378<br />
Ramanathapuram 11.4 0.89169 49.4 0.51884 0.68112<br />
Ariyalur 2.1 0.99022 47.3 0.49439 0.69529<br />
Villupuram 10.9 0.89696 55.1 0.58479 0.69655<br />
Thiruvannamalai 1.2 1.00000 58.1 0.62018 0.70323<br />
Perambalur 6.5 0.94371 48.1 0.50340 0.70619<br />
Pudukkottai 3.5 0.97600 53.4 0.56506 0.70919<br />
Salem 11.9 0.88643 54.6 0.57872 0.72383<br />
Vellore 7.6 0.93199 55.7 0.59182 0.72538<br />
Cuddallore 12.9 0.87623 56.3 0.59882 0.73888<br />
Source: Ranking and mapping of districts, International Institute of Population Sciences (2006), Bombay.<br />
Note: Districts are based on 2001 Census. For all districts in Tamil Nadu, see Appendix Table 4.6.<br />
81


