

POVERTY REDUCTION STRATEGY TN

You also want an ePaper? Increase the reach of your titles
YUMPU automatically turns print PDFs into web optimized ePapers that Google loves.
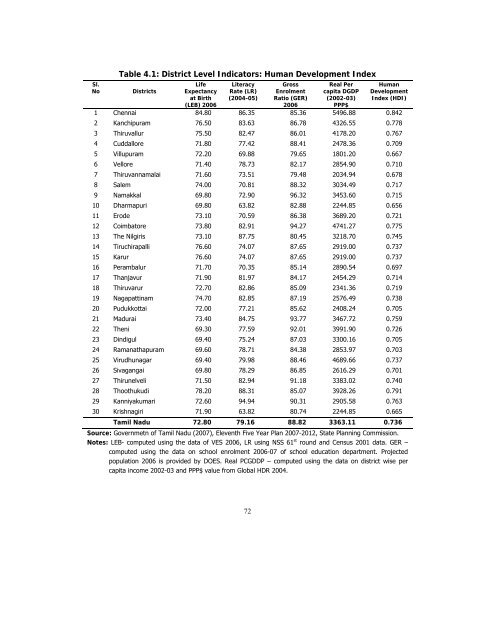
Table 4.1: District Level Indicators: Human Development Index<br />
Sl.<br />
No<br />
Districts<br />
Life<br />
Expectancy<br />
at Birth<br />
Literacy<br />
Rate (LR)<br />
(2004-05)<br />
Gross<br />
Enrolment<br />
Ratio (GER)<br />
Real Per<br />
capita DGDP<br />
(2002-03)<br />
Human<br />
Development<br />
Index (HDI)<br />
(LEB) 2006<br />
2006<br />
PPP$<br />
1 Chennai 84.80 86.35 85.36 5496.88 0.842<br />
2 Kanchipuram 76.50 83.63 86.78 4326.55 0.778<br />
3 Thiruvallur 75.50 82.47 86.01 4178.20 0.767<br />
4 Cuddallore 71.80 77.42 88.41 2478.36 0.709<br />
5 Villupuram 72.20 69.88 79.65 1801.20 0.667<br />
6 Vellore 71.40 78.73 82.17 2854.90 0.710<br />
7 Thiruvannamalai 71.60 73.51 79.48 2034.94 0.678<br />
8 Salem 74.00 70.81 88.32 3034.49 0.717<br />
9 Namakkal 69.80 72.90 96.32 3453.60 0.715<br />
10 Dharmapuri 69.80 63.82 82.88 2244.85 0.656<br />
11 Erode 73.10 70.59 86.38 3689.20 0.721<br />
12 Coimbatore 73.80 82.91 94.27 4741.27 0.775<br />
13 The Nilgiris 73.10 87.75 80.45 3218.70 0.745<br />
14 Tiruchirapalli 76.60 74.07 87.65 2919.00 0.737<br />
15 Karur 76.60 74.07 87.65 2919.00 0.737<br />
16 Perambalur 71.70 70.35 85.14 2890.54 0.697<br />
17 Thanjavur 71.90 81.97 84.17 2454.29 0.714<br />
18 Thiruvarur 72.70 82.86 85.09 2341.36 0.719<br />
19 Nagapattinam 74.70 82.85 87.19 2576.49 0.738<br />
20 Pudukkottai 72.00 77.21 85.62 2408.24 0.705<br />
21 Madurai 73.40 84.75 93.77 3467.72 0.759<br />
22 Theni 69.30 77.59 92.01 3991.90 0.726<br />
23 Dindigul 69.40 75.24 87.03 3300.16 0.705<br />
24 Ramanathapuram 69.60 78.71 84.38 2853.97 0.703<br />
25 Virudhunagar 69.40 79.98 88.46 4689.66 0.737<br />
26 Sivagangai 69.80 78.29 86.85 2616.29 0.701<br />
27 Thirunelveli 71.50 82.94 91.18 3383.02 0.740<br />
28 Thoothukudi 78.20 88.31 85.07 3928.26 0.791<br />
29 Kanniyakumari 72.60 94.94 90.31 2905.58 0.763<br />
30 Krishnagiri 71.90 63.82 80.74 2244.85 0.665<br />
Tamil Nadu 72.80 79.16 88.82 3363.11 0.736<br />
Source: Governmetn of Tamil Nadu (2007), Eleventh Five Year Plan 2007-2012, State Planning Commission.<br />
Notes: LEB- computed using the data of VES 2006, LR using NSS 61 st round and Census 2001 data. GER –<br />
computed using the data on school enrolment 2006-07 of school education department. Projected<br />
population 2006 is provided by DOES. Real PCGDDP – computed using the data on district wise per<br />
capita income 2002-03 and PPP$ value from Global HDR 2004.<br />
72


