

POVERTY REDUCTION STRATEGY TN

You also want an ePaper? Increase the reach of your titles
YUMPU automatically turns print PDFs into web optimized ePapers that Google loves.
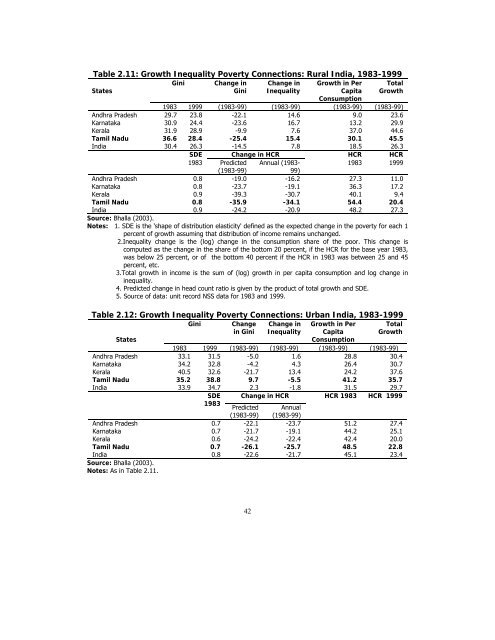
Table 2.11: Growth Inequality Poverty Connections: Rural India, 1983-1999<br />
States<br />
Gini<br />
Change in<br />
Gini<br />
Change in<br />
Inequality<br />
Growth in Per<br />
Capita<br />
Consumption<br />
Total<br />
Growth<br />
1983 1999 (1983-99) (1983-99) (1983-99) (1983-99)<br />
Andhra Pradesh 29.7 23.8 -22.1 14.6 9.0 23.6<br />
Karnataka 30.9 24.4 -23.6 16.7 13.2 29.9<br />
Kerala 31.9 28.9 -9.9 7.6 37.0 44.6<br />
Tamil Nadu 36.6 28.4 -25.4 15.4 30.1 45.5<br />
India 30.4 26.3 -14.5 7.8 18.5 26.3<br />
SDE Change in HCR HCR HCR<br />
1983 Predicted Annual (1983-<br />
1983 1999<br />
(1983-99)<br />
99)<br />
Andhra Pradesh 0.8 -19.0 -16.2 27.3 11.0<br />
Karnataka 0.8 -23.7 -19.1 36.3 17.2<br />
Kerala 0.9 -39.3 -30.7 40.1 9.4<br />
Tamil Nadu 0.8 -35.9 -34.1 54.4 20.4<br />
India 0.9 -24.2 -20.9 48.2 27.3<br />
Source: Bhalla (2003).<br />
Notes: 1. SDE is the 'shape of distribution elasticity' defined as the expected change in the poverty for each 1<br />
percent of growth assuming that distribution of income remains unchanged.<br />
2.Inequality change is the (log) change in the consumption share of the poor. This change is<br />
computed as the change in the share of the bottom 20 percent, if the HCR for the base year 1983,<br />
was below 25 percent, or of the bottom 40 percent if the HCR in 1983 was between 25 and 45<br />
percent, etc.<br />
3.Total growth in income is the sum of (log) growth in per capita consumption and log change in<br />
inequality.<br />
4. Predicted change in head count ratio is given by the product of total growth and SDE.<br />
5. Source of data: unit record NSS data for 1983 and 1999.<br />
Table 2.12: Growth Inequality Poverty Connections: Urban India, 1983-1999<br />
Gini<br />
Change<br />
in Gini<br />
Change in<br />
Inequality<br />
Growth in Per<br />
Capita<br />
Consumption<br />
Total<br />
Growth<br />
States<br />
1983 1999 (1983-99) (1983-99) (1983-99) (1983-99)<br />
Andhra Pradesh 33.1 31.5 -5.0 1.6 28.8 30.4<br />
Karnataka 34.2 32.8 -4.2 4.3 26.4 30.7<br />
Kerala 40.5 32.6 -21.7 13.4 24.2 37.6<br />
Tamil Nadu 35.2 38.8 9.7 -5.5 41.2 35.7<br />
India 33.9 34.7 2.3 -1.8 31.5 29.7<br />
SDE Change in HCR HCR 1983 HCR 1999<br />
1983<br />
Predicted<br />
(1983-99)<br />
Annual<br />
(1983-99)<br />
Andhra Pradesh 0.7 -22.1 -23.7 51.2 27.4<br />
Karnataka 0.7 -21.7 -19.1 44.2 25.1<br />
Kerala 0.6 -24.2 -22.4 42.4 20.0<br />
Tamil Nadu 0.7 -26.1 -25.7 48.5 22.8<br />
India 0.8 -22.6 -21.7 45.1 23.4<br />
Source: Bhalla (2003).<br />
Notes: As in Table 2.11.<br />
42


