

POVERTY REDUCTION STRATEGY TN

Create successful ePaper yourself
Turn your PDF publications into a flip-book with our unique Google optimized e-Paper software.
which are significantly higher than rural prices. They find no evidence in the NSS<br />
purchase data that corresponds with this finding. There is also a discrepancy between<br />
the interstate price indexes incorporated in the Expert Group and official poverty lines,<br />
and those generated by the purchase data in this study. One of the main conclusions of<br />
their paper is that current official practice produces larger errors in calculating the<br />
distribution of poverty within a country than in calculating the changes in poverty levels<br />
over a period of time. Updating base poverty lines involves ‘correcting’ these for urban to<br />
rural price and interstate price differences, and Deaton and Tarozzi have shown that such<br />
specific numerical corrections are not easy to make.<br />
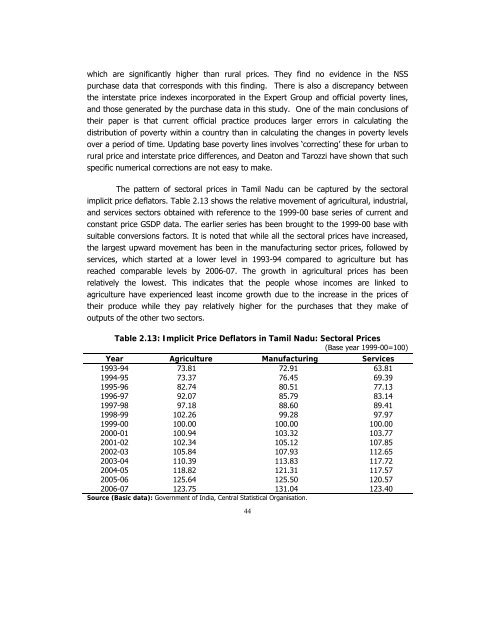
The pattern of sectoral prices in Tamil Nadu can be captured by the sectoral<br />
implicit price deflators. Table 2.13 shows the relative movement of agricultural, industrial,<br />
and services sectors obtained with reference to the 1999-00 base series of current and<br />
constant price GSDP data. The earlier series has been brought to the 1999-00 base with<br />
suitable conversions factors. It is noted that while all the sectoral prices have increased,<br />
the largest upward movement has been in the manufacturing sector prices, followed by<br />
services, which started at a lower level in 1993-94 compared to agriculture but has<br />
reached comparable levels by 2006-07. The growth in agricultural prices has been<br />
relatively the lowest. This indicates that the people whose incomes are linked to<br />
agriculture have experienced least income growth due to the increase in the prices of<br />
their produce while they pay relatively higher for the purchases that they make of<br />
outputs of the other two sectors.<br />
Table 2.13: Implicit Price Deflators in Tamil Nadu: Sectoral Prices<br />
(Base year 1999-00=100)<br />
Year Agriculture Manufacturing Services<br />
1993-94 73.81 72.91 63.81<br />
1994-95 73.37 76.45 69.39<br />
1995-96 82.74 80.51 77.13<br />
1996-97 92.07 85.79 83.14<br />
1997-98 97.18 88.60 89.41<br />
1998-99 102.26 99.28 97.97<br />
1999-00 100.00 100.00 100.00<br />
2000-01 100.94 103.32 103.77<br />
2001-02 102.34 105.12 107.85<br />
2002-03 105.84 107.93 112.65<br />
2003-04 110.39 113.83 117.72<br />
2004-05 118.82 121.31 117.57<br />
2005-06 125.64 125.50 120.57<br />
2006-07 123.75 131.04 123.40<br />
Source (Basic data): Government of India, Central Statistical Organisation.<br />
44


