POVERTY REDUCTION STRATEGY TN
Create successful ePaper yourself
Turn your PDF publications into a flip-book with our unique Google optimized e-Paper software.
Table 2.14 shows the movement in relative terms of trade, highlighting that in<br />
the latter part of the nineties, agricultural prices went down relative to those of the other<br />
sectors in Tamil Nadu. In the case of manufacturing this trend, except for one year,<br />
remains. There has also been a fall in agricultural price terms of trade relative to services<br />
over the years. In the mid-nineties, it was substantially higher than 100 but has gradually<br />
fallen and is close to 100.<br />
These trends indicate that there will be strengthening of migration from<br />
agriculture to non-agricultural activities both because of relatively lower growth of output<br />
and relatively unfavorable price movements.<br />
2.5 Challenges of the Changing Demographic Profile<br />
The projected population growth rate in Tamil Nadu is estimated to fall from 0.9 percent<br />
in 2001-05 to about 0.3 percent in 2021-25. This will imply a changing age structure of<br />
population in Tamil Nadu.<br />
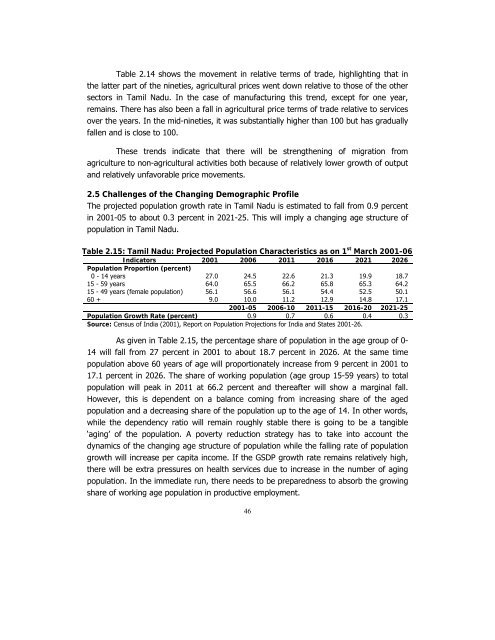
Table 2.15: Tamil Nadu: Projected Population Characteristics as on 1 st March 2001-06<br />
Indicators 2001 2006 2011 2016 2021 2026<br />
Population Proportion (percent)<br />
0 - 14 years 27.0 24.5 22.6 21.3 19.9 18.7<br />
15 - 59 years 64.0 65.5 66.2 65.8 65.3 64.2<br />
15 - 49 years (female population) 56.1 56.6 56.1 54.4 52.5 50.1<br />
60 + 9.0 10.0 11.2 12.9 14.8 17.1<br />
2001-05 2006-10 2011-15 2016-20 2021-25<br />
Population Growth Rate (percent) 0.9 0.7 0.6 0.4 0.3<br />
Source: Census of India (2001), Report on Population Projections for India and States 2001-26.<br />
As given in Table 2.15, the percentage share of population in the age group of 0-<br />
14 will fall from 27 percent in 2001 to about 18.7 percent in 2026. At the same time<br />
population above 60 years of age will proportionately increase from 9 percent in 2001 to<br />
17.1 percent in 2026. The share of working population (age group 15-59 years) to total<br />
population will peak in 2011 at 66.2 percent and thereafter will show a marginal fall.<br />
However, this is dependent on a balance coming from increasing share of the aged<br />
population and a decreasing share of the population up to the age of 14. In other words,<br />
while the dependency ratio will remain roughly stable there is going to be a tangible<br />
‘aging’ of the population. A poverty reduction strategy has to take into account the<br />
dynamics of the changing age structure of population while the falling rate of population<br />
growth will increase per capita income. If the GSDP growth rate remains relatively high,<br />
there will be extra pressures on health services due to increase in the number of aging<br />
population. In the immediate run, there needs to be preparedness to absorb the growing<br />
share of working age population in productive employment.<br />
46


