

POVERTY REDUCTION STRATEGY TN

You also want an ePaper? Increase the reach of your titles
YUMPU automatically turns print PDFs into web optimized ePapers that Google loves.
durable seen as an extreme deprivation at par with ‘having less than one square meal per<br />
day for major part of the year’.<br />
Further, the ranking on the aggregate score of rural households is not needed for<br />
programmes addressing deprivations that are universal in scope like illiteracy, lack of<br />
sanitation, and safe drinking water. The ranking is not relevant for key employment<br />
programmes (JGSY and EAS) that are focused on locations of need and not at individual<br />
households. The ranking does not matter for programmes like Antyodaya and<br />
Annapoorna. In a recent study, Jalan and Murgai (2006), by mapping of BPL criteria to<br />
NSS data, find that the BPL identification methodology is a weak mechanism for<br />
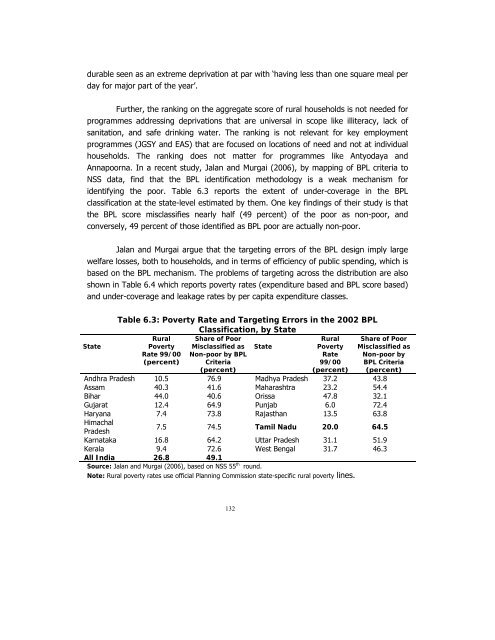
identifying the poor. Table 6.3 reports the extent of under-coverage in the BPL<br />
classification at the state-level estimated by them. One key findings of their study is that<br />
the BPL score misclassifies nearly half (49 percent) of the poor as non-poor, and<br />
conversely, 49 percent of those identified as BPL poor are actually non-poor.<br />
Jalan and Murgai argue that the targeting errors of the BPL design imply large<br />
welfare losses, both to households, and in terms of efficiency of public spending, which is<br />
based on the BPL mechanism. The problems of targeting across the distribution are also<br />
shown in Table 6.4 which reports poverty rates (expenditure based and BPL score based)<br />
and under-coverage and leakage rates by per capita expenditure classes.<br />
State<br />
Table 6.3: Poverty Rate and Targeting Errors in the 2002 BPL<br />
Classification, by State<br />
Rural<br />
Poverty<br />
Rate 99/00<br />
(percent)<br />
Share of Poor<br />
Misclassified as<br />
Non-poor by BPL<br />
Criteria<br />
(percent)<br />
State<br />
Rural<br />
Poverty<br />
Rate<br />
99/00<br />
(percent)<br />
Share of Poor<br />
Misclassified as<br />
Non-poor by<br />
BPL Criteria<br />
(percent)<br />
Andhra Pradesh 10.5 76.9 Madhya Pradesh 37.2 43.8<br />
Assam 40.3 41.6 Maharashtra 23.2 54.4<br />
Bihar 44.0 40.6 Orissa 47.8 32.1<br />
Gujarat 12.4 64.9 Punjab 6.0 72.4<br />
Haryana 7.4 73.8 Rajasthan 13.5 63.8<br />
Himachal<br />
Pradesh<br />
7.5 74.5 Tamil Nadu 20.0 64.5<br />
Karnataka 16.8 64.2 Uttar Pradesh 31.1 51.9<br />
Kerala 9.4 72.6 West Bengal 31.7 46.3<br />
All India 26.8 49.1<br />
Source: Jalan and Murgai (2006), based on NSS 55 th round.<br />
Note: Rural poverty rates use official Planning Commission state-specific rural poverty lines.<br />
132


