- Page 1:
MONOGRAPH 6/2010 MDGs-BASED POVERTY
- Page 5 and 6:
MONOGRAPH 6/2010 March 2010 Price:
- Page 7 and 8:
CONTENTS Acknowledgements Contents
- Page 9 and 10:
List of Tables Table 1.1 Millennium
- Page 11 and 12:
Table 5.10 Status of Urban Water Su
- Page 13 and 14:
Appendix 1.12 Maternal Mortality an
- Page 15 and 16:
MDGs-Based Poverty Reduction: Main
- Page 17 and 18:
. In terms of share of below povert
- Page 19 and 20:
of expenditure on public goods like
- Page 21 and 22:
households or individuals. For each
- Page 23 and 24:
Chapter 1 ISSUES AND INITIAL CONDIT
- Page 25 and 26:
The first three goals relate to era
- Page 27 and 28:
. Poverty in Tamil Nadu: Inter-stat
- Page 29 and 30:
and the urban poverty ratio was sli
- Page 31 and 32:
the total poor accounted for a prog
- Page 33 and 34:
physical development of people. Mor
- Page 35 and 36:
Table 1.11: Millennium Development
- Page 37 and 38:
indicates that Tamil Nadu will achi
- Page 39 and 40:
However, there is a scope for meeti
- Page 41 and 42:
status of malnutrition. The accepte
- Page 43 and 44:
The under-five mortality rate-U5MR
- Page 45 and 46:
(iv) HIV/AIDS, Malaria and Other Di
- Page 47 and 48:
3. While Tami Nadu has done compara
- Page 49 and 50:
Chapter 2 REDUCING POVERTY: THE MAC
- Page 51 and 52:
est of the economy indicates the ex
- Page 53 and 54:
share of the tertiary sector in Tam
- Page 55 and 56:
Chart 2.1: Sectoral Growth in Tamil
- Page 57 and 58:
policies are in place to absorb lar
- Page 59 and 60:
In the context of interface between
- Page 61 and 62:
Table 2.7: Decomposition of the Hea
- Page 63 and 64:
Dutt are not so relevant for predic
- Page 65 and 66:
The SDE estimates vary across the s
- Page 67 and 68:
Chart 2.3 highlights that agricultu
- Page 69 and 70:
2.6 Summary In summary the followin
- Page 71 and 72:
Chapter 3 FISCAL REFORMS FOR POVERT
- Page 73 and 74:
Bardhan (1996) emphasizes that ofte
- Page 75 and 76:
atio of government employees to pop
- Page 77 and 78:
Table 3.2: Tamil Nadu in Inter-stat
- Page 79 and 80:
Chart 3.4: Own Tax Revenues Relativ
- Page 81 and 82:
collected by state-owned enterprise
- Page 83 and 84:
Chart 3.5: Capital Outlay as percen
- Page 85 and 86:
The Fiscal Policy Strategy Statemen
- Page 87 and 88:
f. Pension and Salary Expenditures
- Page 89 and 90:
10 it is kept at 40 percent to acco
- Page 91 and 92:
Government of Tamil Nadu has to sub
- Page 93 and 94:
Chapter 4 COPING WITH SPATIAL IMBAL
- Page 95 and 96:
In order to focus on the deficient
- Page 97 and 98:
Chart 4.2 indicates the arrangement
- Page 99 and 100:
Chart 4.5: Human Development Index:
- Page 101 and 102:
Table 4.4: Index of Gender Deficien
- Page 103 and 104:
Districts Table 4.7: Health Facilit
- Page 105 and 106:
Regarding access costs in availing
- Page 107 and 108:
4.6 Incidence of Poverty: District
- Page 109 and 110:
district followed by Villupuram and
- Page 111 and 112:
household willing to do public work
- Page 113 and 114:
Districts Table 4.13: Implementatio
- Page 115 and 116:
Table 4.14: Share of BPL Population
- Page 117 and 118:
Table 4.16: Block -wise Gross Acces
- Page 119 and 120:
Table 4.18: Block-wise IMR in Thiru
- Page 121 and 122:
8. For provision of safe drinking w
- Page 123 and 124:
Chapter 5 WATER, LAND AND AGRICULTU
- Page 125 and 126:
5.2 Water: Key Issues in Tamil Nadu
- Page 127 and 128:
Table 5.3: Sources of Water Supply
- Page 129 and 130:
funding under the Water Resources C
- Page 131 and 132:
In 2006-7, 65.83 percent of habitat
- Page 133 and 134:
the major cause for poor maintenanc
- Page 135 and 136:
about 30 litre per capita per day (
- Page 137 and 138:
2006-07). However, total area under
- Page 139 and 140:
nearly 3.5 times as high as the pri
- Page 141 and 142:
5.4 Agriculture: Key Issues Agricul
- Page 143 and 144:
Table 5.19: Productivity (Yield) of
- Page 145 and 146:
Only rice and sugarcane received ir
- Page 147 and 148:
iv. There are severe water quality
- Page 149 and 150:
Chapter 6 LAST MILE REACH STRATEGIE
- Page 151 and 152:
targeting as a device to improve ef
- Page 153 and 154:
eneficiaries and of delivering prog
- Page 155 and 156:
In the nighbourhood of the poverty
- Page 157 and 158:
inefficiencies. Some of the major c
- Page 159 and 160:
Tamil Nadu is close to achieving un
- Page 161 and 162:
programmes. It is the only Self Emp
- Page 163 and 164:
districts in Tamil Nadu. Namadhu Gr
- Page 165 and 166:
6.5 Reaching Households and Individ
- Page 167 and 168:
proposition more insurable, a group
- Page 169 and 170:
line to post-office saving banks or
- Page 171 and 172:
each the urban poor who live in slu
- Page 173 and 174:
Eleventh Plan (2007) observes: “O
- Page 175 and 176:
i. provide financial assistance for
- Page 177 and 178:
unemployed or underemployed poor by
- Page 179 and 180:
Services Prepare detailed water sup
- Page 181 and 182:
Chapter 7 SUMMARY AND FORMULATION O
- Page 183 and 184:
positive and relatively high. The b
- Page 185 and 186:
3. In terms of composition of BPL p
- Page 187 and 188:
holdings are smaller than 4 hectare
- Page 189 and 190:
There are considerable inter-distri
- Page 191 and 192:
Table 7.1: Adjustment during 2007-0
- Page 193 and 194:
R i =(I a +I max -I i )/(I a +I max
- Page 195 and 196:
line to post-office saving banks or
- Page 197 and 198:
d. Targeting As far as rural areas
- Page 199 and 200:
7.6 Urban Poverty Reduction Strateg
- Page 201 and 202:
Fund, GoTN has created Tamil Nadu I
- Page 203 and 204:
Some initiative by Government of Ta
- Page 205 and 206:
• Addressing urban poverty allevi
- Page 207 and 208:
land. There is need to develop a sc
- Page 209 and 210:
REFERENCES Agarwal, S.P. (2005),
- Page 211 and 212: Deaton, Angus and Alessandro Tarozz
- Page 213 and 214: Himmelfarb, G. (1984), The Idea of
- Page 215 and 216: Report of the Working Group on Urba
- Page 217 and 218: APPENDIX TABLES Appendix Table 1.1:
- Page 219 and 220: Appendix Table 1.1 (contd.): Millen
- Page 221 and 222: Appendix Table 1.2 (a): Poverty Lin
- Page 223 and 224: Appendix Table 1.3: Poverty Gap Est
- Page 225 and 226: Appendix Table 1.5: Head Count Rati
- Page 227 and 228: Appendix Table 1.6 (contd.): Progre
- Page 229 and 230: Appendix Table 1.8: Women’s Malnu
- Page 231 and 232: Appendix Table 1.10: Child Mortalit
- Page 233 and 234: Appendix Table 1.11 (contd.): State
- Page 235 and 236: Appendix Table1.12 (contd.): Matern
- Page 237 and 238: Appendix Table 2.3: Decomposition o
- Page 239 and 240: and Publicity Relief from Natural C
- Page 241 and 242: Appendix Table 4.3: Demography Rela
- Page 243 and 244: Appendix Table 4.5: Health Faciliti
- Page 245 and 246: Sl. No Appendix Table 4.7: Efficien
- Page 247 and 248: Appendix Table 4.9: Employment unde
- Page 249 and 250: Appendix Table 5.1: Major and Mediu
- Page 251 and 252: Appendix Table 7.1: Indices for Dis
- Page 253 and 254: ANNEXURES 231
- Page 255 and 256: Monotonicity Sensitivity Axiom Mono
- Page 257 and 258: component of the poverty line is th
- Page 259 and 260: Fuchs (1969), while advocating the
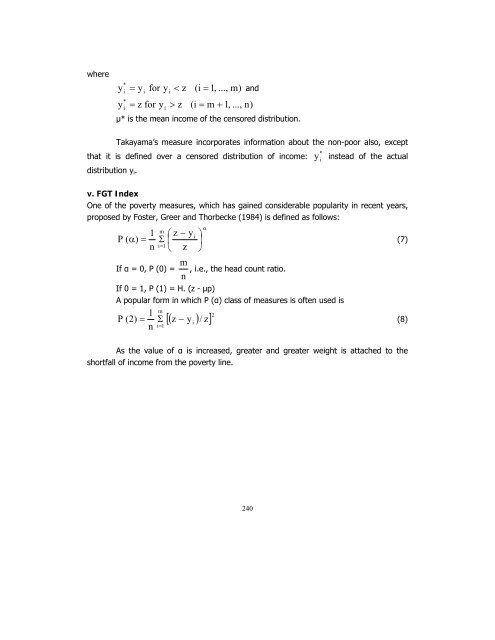
- Page 261: H = m/n (2) The head count ratio ig
- Page 265 and 266: ‣ Periyar became Erode; ‣ Tirun
- Page 267 and 268: Women Receiving 3 Or More ANC Visit
- Page 269 and 270: In Sivagangai, as per 2001 census,
- Page 271 and 272: Table 4.3: Block wise Gender Wise G
- Page 273 and 274: Block Table 4.6: Trained Teachers a
- Page 275 and 276: Annexure 5.1 ENVIRONMENTAL CONSEQUE
- Page 277 and 278: Annexure 6.1 NOTES ON SELECTED CENT
- Page 279 and 280: 10. Kasturba Gandhi Balika Vidyalay
- Page 281: MSE Working Papers Recent Issues *


