

POVERTY REDUCTION STRATEGY TN

Create successful ePaper yourself
Turn your PDF publications into a flip-book with our unique Google optimized e-Paper software.
districts, 16 (55 percent) were technically efficient as they had relative efficiency score of<br />
1.00 and, therefore, lie on the efficiency frontier (see Appendix 4.7 for details). The<br />
remaining 13 (45 percent) districts were technically inefficient with scores ranging from<br />
0.66 (Ramanathapuram district) to 0.98 (Dindigul district). These scores indicate that<br />
districts like Ramanathapuram and Dindigul could reduce their current inputs by 34<br />
percent and 2 percent, respectively, without altering the current level of output.<br />
However, this has to be qualified because the inefficiency of the districts like<br />
Ramanathapuram, Sivagangai or Nilgiris might be more due to some exogenous variables<br />
like poor infrastructure or socio economic factors or the hilly and geographic nature than<br />
the nature of the health care system. The average Technical Efficiency score among the<br />
inefficient districts was 85 percent, which means that the technically inefficient hospitals<br />
could reduce their resource use by 15 percent to maintain their current output levels.<br />
4.5 Safe Drinking Water<br />
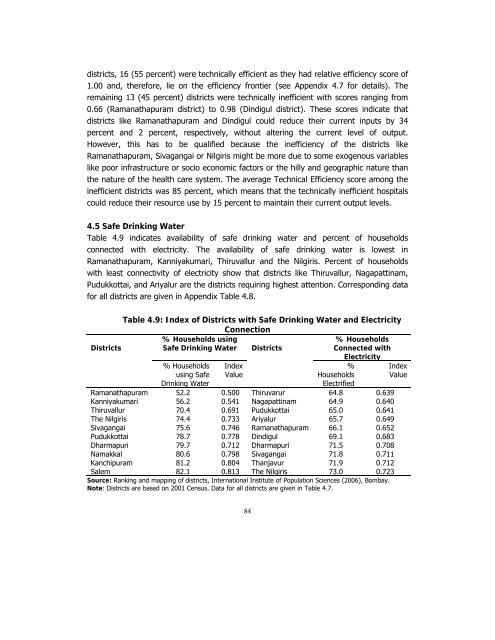
Table 4.9 indicates availability of safe drinking water and percent of households<br />
connected with electricity. The availability of safe drinking water is lowest in<br />
Ramanathapuram, Kanniyakumari, Thiruvallur and the Nilgiris. Percent of households<br />
with least connectivity of electricity show that districts like Thiruvallur, Nagapattinam,<br />
Pudukkottai, and Ariyalur are the districts requiring highest attention. Corresponding data<br />
for all districts are given in Appendix Table 4.8.<br />
Table 4.9: Index of Districts with Safe Drinking Water and Electricity<br />
Connection<br />
Districts<br />
% Households using<br />
Safe Drinking Water Districts<br />
% Households<br />
Connected with<br />
Electricity<br />
% Households<br />
using Safe<br />
Drinking Water<br />
Index<br />
Value<br />
%<br />
Households<br />
Electrified<br />
Ramanathapuram 52.2 0.500 Thiruvarur 64.8 0.639<br />
Kanniyakumari 56.2 0.541 Nagapattinam 64.9 0.640<br />
Thiruvallur 70.4 0.691 Pudukkottai 65.0 0.641<br />
The Nilgiris 74.4 0.733 Ariyalur 65.7 0.649<br />
Sivagangai 75.6 0.746 Ramanathapuram 66.1 0.652<br />
Pudukkottai 78.7 0.778 Dindigul 69.1 0.683<br />
Dharmapuri 79.7 0.712 Dharmapuri 71.5 0.708<br />
Namakkal 80.6 0.798 Sivagangai 71.8 0.711<br />
Kanchipuram 81.2 0.804 Thanjavur 71.9 0.712<br />
Salem 82.1 0.813 The Nilgiris 73.0 0.723<br />
Source: Ranking and mapping of districts, International Institute of Population Sciences (2006), Bombay.<br />
Note: Districts are based on 2001 Census. Data for all districts are given in Table 4.7.<br />
Index<br />
Value<br />
84


