

POVERTY REDUCTION STRATEGY TN

You also want an ePaper? Increase the reach of your titles
YUMPU automatically turns print PDFs into web optimized ePapers that Google loves.
may be noted that even with the introduction of VAT, given the high petroleum prices<br />
and since these are subjected to special rates within the structure of state VAT, it is likely<br />
that the state government will achieve its revenue rising targets.<br />
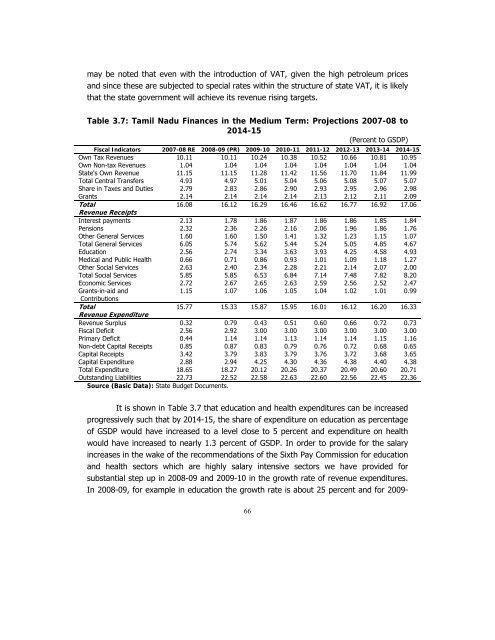
Table 3.7: Tamil Nadu Finances in the Medium Term: Projections 2007-08 to<br />
2014-15<br />
(Percent to GSDP)<br />
Fiscal Indicators 2007-08 RE 2008-09 (PR) 2009-10 2010-11 2011-12 2012-13 2013-14 2014-15<br />
Own Tax Revenues 10.11 10.11 10.24 10.38 10.52 10.66 10.81 10.95<br />
Own Non-tax Revenues 1.04 1.04 1.04 1.04 1.04 1.04 1.04 1.04<br />
State's Own Revenue 11.15 11.15 11.28 11.42 11.56 11.70 11.84 11.99<br />
Total Central Transfers 4.93 4.97 5.01 5.04 5.06 5.08 5.07 5.07<br />
Share in Taxes and Duties 2.79 2.83 2.86 2.90 2.93 2.95 2.96 2.98<br />
Grants 2.14 2.14 2.14 2.14 2.13 2.12 2.11 2.09<br />
Total 16.08 16.12 16.29 16.46 16.62 16.77 16.92 17.06<br />
Revenue Receipts<br />
Interest payments 2.13 1.78 1.86 1.87 1.86 1.86 1.85 1.84<br />
Pensions 2.32 2.36 2.26 2.16 2.06 1.96 1.86 1.76<br />
Other General Services 1.60 1.60 1.50 1.41 1.32 1.23 1.15 1.07<br />
Total General Services 6.05 5.74 5.62 5.44 5.24 5.05 4.85 4.67<br />
Education 2.56 2.74 3.34 3.63 3.93 4.25 4.58 4.93<br />
Medical and Public Health 0.66 0.71 0.86 0.93 1.01 1.09 1.18 1.27<br />
Other Social Services 2.63 2.40 2.34 2.28 2.21 2.14 2.07 2.00<br />
Total Social Services 5.85 5.85 6.53 6.84 7.14 7.48 7.82 8.20<br />
Economic Services 2.72 2.67 2.65 2.63 2.59 2.56 2.52 2.47<br />
Grants-in-aid and<br />
1.15 1.07 1.06 1.05 1.04 1.02 1.01 0.99<br />
Contributions<br />
Total 15.77 15.33 15.87 15.95 16.01 16.12 16.20 16.33<br />
Revenue Expenditure<br />
Revenue Surplus 0.32 0.79 0.43 0.51 0.60 0.66 0.72 0.73<br />
Fiscal Deficit 2.56 2.92 3.00 3.00 3.00 3.00 3.00 3.00<br />
Primary Deficit 0.44 1.14 1.14 1.13 1.14 1.14 1.15 1.16<br />
Non-debt Capital Receipts 0.85 0.87 0.83 0.79 0.76 0.72 0.68 0.65<br />
Capital Receipts 3.42 3.79 3.83 3.79 3.76 3.72 3.68 3.65<br />
Capital Expenditure 2.88 2.94 4.25 4.30 4.36 4.38 4.40 4.38<br />
Total Expenditure 18.65 18.27 20.12 20.26 20.37 20.49 20.60 20.71<br />
Outstanding Liabilities 22.73 22.52 22.58 22.63 22.60 22.56 22.45 22.36<br />
Source (Basic Data): State Budget Documents.<br />
It is shown in Table 3.7 that education and health expenditures can be increased<br />
progressively such that by 2014-15, the share of expenditure on education as percentage<br />
of GSDP would have increased to a level close to 5 percent and expenditure on health<br />
would have increased to nearly 1.3 percent of GSDP. In order to provide for the salary<br />
increases in the wake of the recommendations of the Sixth Pay Commission for education<br />
and health sectors which are highly salary intensive sectors we have provided for<br />
substantial step up in 2008-09 and 2009-10 in the growth rate of revenue expenditures.<br />
In 2008-09, for example in education the growth rate is about 25 percent and for 2009-<br />
66


