

POVERTY REDUCTION STRATEGY TN

You also want an ePaper? Increase the reach of your titles
YUMPU automatically turns print PDFs into web optimized ePapers that Google loves.
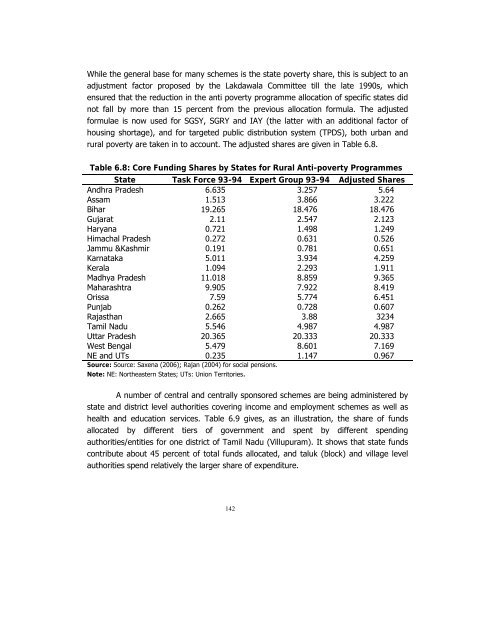
While the general base for many schemes is the state poverty share, this is subject to an<br />
adjustment factor proposed by the Lakdawala Committee till the late 1990s, which<br />
ensured that the reduction in the anti poverty programme allocation of specific states did<br />
not fall by more than 15 percent from the previous allocation formula. The adjusted<br />
formulae is now used for SGSY, SGRY and IAY (the latter with an additional factor of<br />
housing shortage), and for targeted public distribution system (TPDS), both urban and<br />
rural poverty are taken in to account. The adjusted shares are given in Table 6.8.<br />
Table 6.8: Core Funding Shares by States for Rural Anti-poverty Programmes<br />
State Task Force 93-94 Expert Group 93-94 Adjusted Shares<br />
Andhra Pradesh 6.635 3.257 5.64<br />
Assam 1.513 3.866 3.222<br />
Bihar 19.265 18.476 18.476<br />
Gujarat 2.11 2.547 2.123<br />
Haryana 0.721 1.498 1.249<br />
Himachal Pradesh 0.272 0.631 0.526<br />
Jammu &Kashmir 0.191 0.781 0.651<br />
Karnataka 5.011 3.934 4.259<br />
Kerala 1.094 2.293 1.911<br />
Madhya Pradesh 11.018 8.859 9.365<br />
Maharashtra 9.905 7.922 8.419<br />
Orissa 7.59 5.774 6.451<br />
Punjab 0.262 0.728 0.607<br />
Rajasthan 2.665 3.88 3234<br />
Tamil Nadu 5.546 4.987 4.987<br />
Uttar Pradesh 20.365 20.333 20.333<br />
West Bengal 5.479 8.601 7.169<br />
NE and UTs 0.235 1.147 0.967<br />
Source: Source: Saxena (2006); Rajan (2004) for social pensions.<br />
Note: NE: Northeastern States; UTs: Union Territories.<br />
A number of central and centrally sponsored schemes are being administered by<br />
state and district level authorities covering income and employment schemes as well as<br />
health and education services. Table 6.9 gives, as an illustration, the share of funds<br />
allocated by different tiers of government and spent by different spending<br />
authorities/entities for one district of Tamil Nadu (Villupuram). It shows that state funds<br />
contribute about 45 percent of total funds allocated, and taluk (block) and village level<br />
authorities spend relatively the larger share of expenditure.<br />
142


