

POVERTY REDUCTION STRATEGY TN

You also want an ePaper? Increase the reach of your titles
YUMPU automatically turns print PDFs into web optimized ePapers that Google loves.
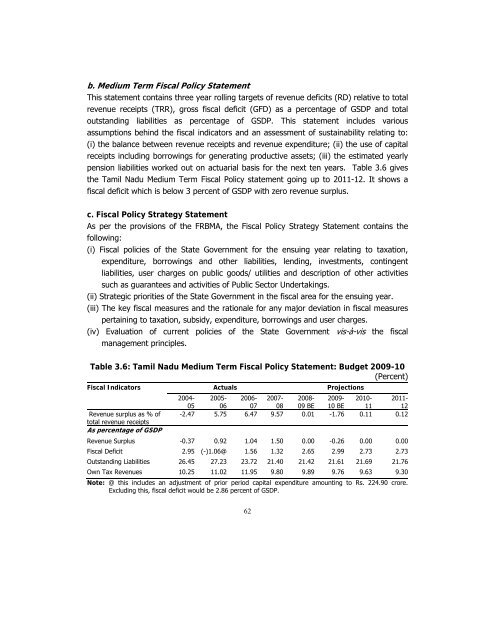
. Medium Term Fiscal Policy Statement<br />
This statement contains three year rolling targets of revenue deficits (RD) relative to total<br />
revenue receipts (TRR), gross fiscal deficit (GFD) as a percentage of GSDP and total<br />
outstanding liabilities as percentage of GSDP. This statement includes various<br />
assumptions behind the fiscal indicators and an assessment of sustainability relating to:<br />
(i) the balance between revenue receipts and revenue expenditure; (ii) the use of capital<br />
receipts including borrowings for generating productive assets; (iii) the estimated yearly<br />
pension liabilities worked out on actuarial basis for the next ten years. Table 3.6 gives<br />
the Tamil Nadu Medium Term Fiscal Policy statement going up to 2011-12. It shows a<br />
fiscal deficit which is below 3 percent of GSDP with zero revenue surplus.<br />
c. Fiscal Policy Strategy Statement<br />
As per the provisions of the FRBMA, the Fiscal Policy Strategy Statement contains the<br />
following:<br />
(i) Fiscal policies of the State Government for the ensuing year relating to taxation,<br />
expenditure, borrowings and other liabilities, lending, investments, contingent<br />
liabilities, user charges on public goods/ utilities and description of other activities<br />
such as guarantees and activities of Public Sector Undertakings.<br />
(ii) Strategic priorities of the State Government in the fiscal area for the ensuing year.<br />
(iii) The key fiscal measures and the rationale for any major deviation in fiscal measures<br />
pertaining to taxation, subsidy, expenditure, borrowings and user charges.<br />
(iv) Evaluation of current policies of the State Government vis-à-vis the fiscal<br />
management principles.<br />
Table 3.6: Tamil Nadu Medium Term Fiscal Policy Statement: Budget 2009-10<br />
(Percent)<br />
Fiscal Indicators Actuals Projections<br />
Revenue surplus as % of<br />
total revenue receipts<br />
As percentage of GSDP<br />
2004- 2005- 2006- 2007- 2008- 2009- 2010- 2011-<br />
05 06 07 08 09 BE 10 BE 11 12<br />
-2.47 5.75 6.47 9.57 0.01 -1.76 0.11 0.12<br />
Revenue Surplus -0.37 0.92 1.04 1.50 0.00 -0.26 0.00 0.00<br />
Fiscal Deficit 2.95 (-)1.06@ 1.56 1.32 2.65 2.99 2.73 2.73<br />
Outstanding Liabilities 26.45 27.23 23.72 21.40 21.42 21.61 21.69 21.76<br />
Own Tax Revenues 10.25 11.02 11.95 9.80 9.89 9.76 9.63 9.30<br />
Note: @ this includes an adjustment of prior period capital expenditure amounting to Rs. 224.90 crore.<br />
Excluding this, fiscal deficit would be 2.86 percent of GSDP.<br />
62


