Tabell V-4.20 Prosent utenlandske statsborgere av registrerte studenter 2005 2006 2007 2008 Utenl. % U Utenl. % U Utenl. % U Utenl. % U Reg. stud Reg. stud Reg. stud Reg. stud pers. av R pers. av R pers. av R pers. av R SH 0 108,1 0,0 31 173,1 17,9 18 178,4 10,1 35 102,5 34,1 HiNa 200 1013 19,7 198 1044,5 19,0 171 1011,6 16,9 161 962,5 16,7 HiO 725 10585,2 6,8 868 11008,6 7,9 982 10983,2 8,9 1035 11107,7 9,3 HiMo 112 1609 7,0 122 1726 7,1 147 1687 8,7 143 1815 7,9 HiFi 77 1837,7 4,2 67 2001,9 3,3 110 1798 6,1 118 1783 6,6 HiHa 71 1325 5,4 66 1228 5,4 49 1210 4,0 65 1170 5,6 HiTe 205 4934 4,2 196 4872,2 4,0 197 5019,9 3,9 280 5111,9 5,5 HiØ 106 3702 2,9 139 3605 3,9 176 3570 4,9 206 3728 5,5 HiBu 140 2632,2 5,3 143 2630,9 5,4 171 2775,5 6,2 155 2928 5,3 HiBo 174 4026,2 4,3 224 3856,1 5,8 206 3841,7 5,4 228 4680,7 4,9 HiTø 84 2797,7 3,0 100 2585 3,9 80 2208,7 3,6 100 2261,8 4,4 HiÅ 46 1525,3 3,0 65 1534,3 4,2 54 1498,2 3,6 64 1604,6 4,0 HiVo 86 3116,5 2,8 97 2833,5 3,4 99 2808,9 3,5 111 2924,6 3,8 HiAk 75 2985,3 2,5 91 3092,7 2,9 90 2920,7 3,1 100 2915 3,4 HiG 47 1649,7 2,8 31 1607,3 1,9 63 1664,7 3,8 64 1916,2 3,3 HSH 56 2254 2,5 69 2307 3,0 69 2384 2,9 86 2610 3,3 HiVe 76 2950 2,6 114 3113 3,7 104 3327 3,1 107 3389 3,2 HiBe 101 5472 1,8 144 5596 2,6 157 5536 2,8 179 5847 3,1 HiHe 162 4357 3,7 77 4073 1,9 103 4198 2,5 128 4317 3,0 HiST 182 6219,3 2,9 197 6160,1 3,2 180 6197,6 2,9 174 6379,5 2,7 HiNT 76 3643,8 2,1 93 3805,1 2,4 96 3929,2 2,4 88 3609,5 2,4 HiSF 23 2811,3 0,8 26 2625 1,0 47 2627,6 1,8 57 2471,7 2,3 HiLi 53 3246,8 1,6 50 2921 1,7 39 3096 1,3 44 3246 1,4 HiNe 20 934,2 2,1 16 941,8 1,7 7 951,6 0,7 14 1225,2 1,1 Sum SH 2897 75735,1 3,8 3224 75341 4,3 3415 75423,3 4,5 3742 78106,3 4,8 UMB 351 2784 12,6 379 2947,4 12,9 427 2937,4 14,5 511 3114,8 16,4 UiB 1635 15924,9 10,3 1710 15711,8 10,9 1635 14551,8 11,2 1751 13998,2 12,5 UiO 3197 30247,5 10,6 3347 29719,5 11,3 3250 27321,7 11,9 3316 26993,2 12,3 UiTø 534 5742,7 9,3 573 5513,7 10,4 566 5287,9 10,7 621 5259 11,8 NTNU 1264 19850 6,4 1410 19776,8 7,1 1610 19397,9 8,3 1716 19516,9 8,8 UiS 450 7066 6,4 474 6928 6,8 532 7441 7,1 651 7579 8,6 UiA 382 7682,7 5,0 411 7660,6 5,4 421 7502,4 5,6 445 7731,7 5,8 Sum U 7813 89297,8 8,7 8304 88257,7 9,4 8441 84440,1 10,0 9011 84192,9 10,7 NVH 62 399 15,5 65 431 15,1 82 465 17,6 91 468 19,4 AHO 0 428 0,0 38 425 8,9 55 475 11,6 58 502 11,6 NHH 204 2537 8,0 218 2572 8,5 262 2781 9,4 326 3012 10,8 NMH 58 549 10,6 46 563 8,2 46 572 8,0 56 571 9,8 NiH 42 858,8 4,9 36 862,5 4,2 11 744,3 1,5 23 756 3,0 Sum SVH 366 4771,8 7,7 403 4853,5 8,3 456 5037,3 9,1 554 5309 10,4 KhiO 60 551 10,9 60 518 11,6 62 510 12,2 62 483 12,8 KhiB 36 301 12,0 35 306 11,4 31 286 10,8 32 305 10,5 Sum KH 96 852 11,3 95 824 11,5 93 796 11,7 94 788 11,9 Totalt 11172 170656,7 6,5 12026 169276,2 7,1 12405 165696,7 7,5 13401 168396,2 8,0 Kilde: <strong>DBH</strong> Merknad: Utenlandske studenter er personer som studerer ved universiteter og høyskoler i Norge, og som har utenlandsk statsborgerskap. En student skal telle med kun på ett program. Telletidspunkt er om høsten. 444
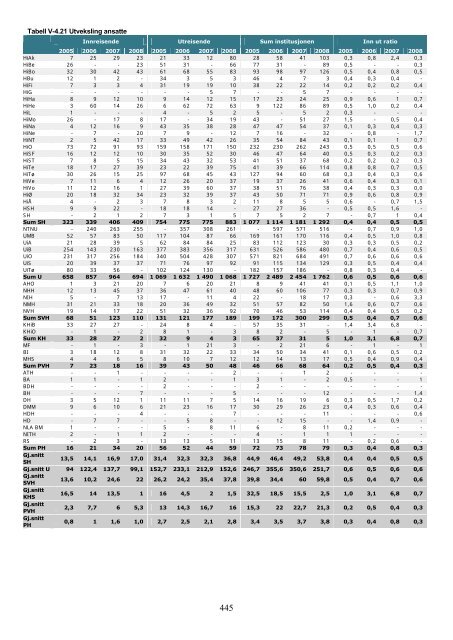
Tabell V-4.21 Utveksling ansatte Innreisende Utreisende Sum institusjonen Inn ut ratio 2005 2006 2007 2008 2005 2006 2007 2008 2005 2006 2007 2008 2005 2006 2007 2008 HiAk 7 25 29 23 21 33 12 80 28 58 41 103 0,3 0,8 2,4 0,3 HiBe 26 - - 23 51 31 - 66 77 31 - 89 0,5 - - 0,3 HiBo 32 30 42 43 61 68 55 83 93 98 97 126 0,5 0,4 0,8 0,5 HBu 12 1 2 - 34 3 5 3 46 4 7 3 0,4 0,3 0,4 - HiFi 7 3 3 4 31 19 19 10 38 22 22 14 0,2 0,2 0,2 0,4 HiG - - - - - - 5 7 - - 5 7 - - - - HiHa 8 9 12 10 9 14 12 15 17 23 24 25 0,9 0,6 1 0,7 HiHe 3 60 14 26 6 62 72 63 9 122 86 89 0,5 1,0 0,2 0,4 HiL 1 - - - 4 - 5 2 5 - 5 2 0,3 - - - HiMo 26 - 17 8 17 - 34 19 43 - 51 27 1,5 - 0,5 0,4 HiNa 4 12 16 9 43 35 38 28 47 47 54 37 0,1 0,3 0,4 0,3 HiNe - 7 - 20 7 9 - 12 7 16 - 32 - 0,8 - 1,7 HiNT 2 5 42 17 33 49 42 26 35 54 84 43 0,1 0,1 1 0,7 HiO 73 72 91 93 159 158 171 150 232 230 262 243 0,5 0,5 0,5 0,6 HiSF 16 12 12 10 30 35 52 30 46 47 64 40 0,5 0,3 0,2 0,3 HiST 7 8 5 15 34 43 32 53 41 51 37 68 0,2 0,2 0,2 0,3 HiTe 18 17 27 39 23 22 39 75 41 39 66 114 0,8 0,8 0,7 0,5 HiTø 30 26 15 25 97 68 45 43 127 94 60 68 0,3 0,4 0,3 0,6 HiVe 7 11 6 4 12 26 20 37 19 37 26 41 0,6 0,4 0,3 0,1 HiVo 11 12 16 1 27 39 60 37 38 51 76 38 0,4 0,3 0,3 0,0 HiØ 20 18 32 34 23 32 39 37 43 50 71 71 0,9 0,6 0,8 0,9 HiÅ 4 - 2 3 7 8 3 2 11 8 5 5 0,6 - 0,7 1,5 HSH 9 9 22 - 18 18 14 - 27 27 36 - 0,5 0,5 1,6 - SH - 2 1 2 7 3 1 5 7 5 2 7 - 0,7 1 0,4 Sum SH 323 339 406 409 754 775 775 883 1 077 1 114 1 181 1 292 0,4 0,4 0,5 0,5 NTNU - 240 263 255 - 357 308 261 - 597 571 516 - 0,7 0,9 1,0 UMB 52 57 83 50 117 104 87 66 169 161 170 116 0,4 0,5 1,0 0,8 UiA 21 28 39 5 62 84 84 25 83 112 123 30 0,3 0,3 0,5 0,2 UiB 254 143 230 163 377 383 356 317 631 526 586 480 0,7 0,4 0,6 0,5 UiO 231 317 256 184 340 504 428 307 571 821 684 491 0,7 0,6 0,6 0,6 UiS 20 39 37 37 71 76 97 92 91 115 134 129 0,3 0,5 0,4 0,4 UiTø 80 33 56 - 102 124 130 - 182 157 186 - 0,8 0,3 0,4 - Sum U 658 857 964 694 1 069 1 632 1 490 1 068 1 727 2 489 2 454 1 762 0,6 0,5 0,6 0,6 AHO 1 3 21 20 7 6 20 21 8 9 41 41 0,1 0,5 1,1 1,0 NHH 12 13 45 37 36 47 61 40 48 60 106 77 0,3 0,3 0,7 0,9 NIH 5 - 7 13 17 - 11 4 22 - 18 17 0,3 - 0,6 3,3 NMH 31 21 33 18 20 36 49 32 51 57 82 50 1,6 0,6 0,7 0,6 NVH 19 14 17 22 51 32 36 92 70 46 53 114 0,4 0,4 0,5 0,2 Sum SVH 68 51 123 110 131 121 177 189 199 172 300 299 0,5 0,4 0,7 0,6 KHiB 33 27 27 - 24 8 4 - 57 35 31 - 1,4 3,4 6,8 - KHiO - 1 - 2 8 1 - 3 8 2 - 5 - 1 - 0,7 Sum KH 33 28 27 2 32 9 4 3 65 37 31 5 1,0 3,1 6,8 0,7 MF - 1 - 3 - 1 21 3 - 2 21 6 - 1 - 1 BI 3 18 12 8 31 32 22 33 34 50 34 41 0,1 0,6 0,5 0,2 MHS 4 4 6 5 8 10 7 12 12 14 13 17 0,5 0,4 0,9 0,4 Sum PVH 7 23 18 16 39 43 50 48 46 66 68 64 0,2 0,5 0,4 0,3 ATH - - 1 - - - - 2 - - 1 2 - - - - BA 1 1 - 1 2 - - 1 3 1 - 2 0,5 - - 1 BDH - - - - 2 - - - 2 - - - - - - - BH - - - 7 - - - 5 - - - 12 - - - 1,4 DH 3 5 12 1 11 11 7 5 14 16 19 6 0,3 0,5 1,7 0,2 DMM 9 6 10 6 21 23 16 17 30 29 26 23 0,4 0,3 0,6 0,4 HDH - - - 4 - - - 7 - - - 11 - - - 0,6 HD - 7 7 - - 5 8 - - 12 15 - - 1,4 0,9 - NLA BM 1 - - - 5 - 8 11 6 - 8 11 0,2 - - - NITH 2 - 1 1 2 - - - 4 - 1 1 1 - - - RS - 2 3 - 13 13 5 11 13 15 8 11 - 0,2 0,6 - Sum PH 16 21 34 20 56 52 44 59 72 73 78 79 0,3 0,4 0,8 0,3 Gj.snitt SH 13,5 14,1 16,9 17,0 31,4 32,3 32,3 36,8 44,9 46,4 49,2 53,8 0,4 0,4 0,5 0,5 Gj.snitt U 94 122,4 137,7 99,1 152,7 233,1 212,9 152,6 246,7 355,6 350,6 251,7 0,6 0,5 0,6 0,6 Gj.snitt SVH 13,6 10,2 24,6 22 26,2 24,2 35,4 37,8 39,8 34,4 60 59,8 0,5 0,4 0,7 0,6 Gj.snitt KHS 16,5 14 13,5 1 16 4,5 2 1,5 32,5 18,5 15,5 2,5 1,0 3,1 6,8 0,7 Gj.snitt PVH 2,3 7,7 6 5,3 13 14,3 16,7 16 15,3 22 22,7 21,3 0,2 0,5 0,4 0,3 Gj.snitt PH 0,8 1 1,6 1,0 2,7 2,5 2,1 2,8 3,4 3,5 3,7 3,8 0,3 0,4 0,8 0,3 445
- Page 1:
Rapport Tilstandsrapport for høyer
- Page 4 and 5:
Versjonshåndtering 1.1, 270409 Opp
- Page 6 and 7:
Kilde til figurer og tabeller er Da
- Page 8 and 9:
3. FORSKNING ......................
- Page 10 and 11:
5.11 Universitetsmuseene ..........
- Page 12 and 13:
Tabell- og figuroversikt Tabell 2.2
- Page 14 and 15:
Tabell 3.11.4 Totale FoU-utgifter i
- Page 17 and 18:
1. Sammendrag 1.1 Utdanning Utvikli
- Page 19 and 20:
Kjønnsballansen i utdanningen Ande
- Page 21 and 22:
1.3 Internasjonalisering 1.3.1 Stud
- Page 23 and 24:
Immaterielle rettigheter Flere av d
- Page 25 and 26:
2. Utdanning 2.1 Innledning I dette
- Page 27 and 28:
såpass stor andel av studentene so
- Page 29 and 30:
Tabell 2.2.4 Utvikling i antall stu
- Page 31 and 32:
2.2.3 Utvikling i fagprofil Fremtid
- Page 33 and 34:
etter innføringen av Kvalitetsrefo
- Page 35 and 36:
Antall søknader til høyere utdann
- Page 37 and 38:
Fra 2005 til 2007 gikk opptakstalle
- Page 39 and 40:
Figur 2.3.1 Utvikling i andel ekste
- Page 41 and 42:
Tabell 2.3.8 Antall innvandrere 3 o
- Page 43 and 44:
deltidsstudenter eller studenter so
- Page 45 and 46:
Høyere grad Ved høyere grads stud
- Page 47 and 48:
Tabell 2.3.15 Ferdige kandidater (e
- Page 49 and 50:
Figur 2.3.4 Registrerte studenter o
- Page 51 and 52:
kole er den institusjonen der førs
- Page 53 and 54:
Arbeidsgruppen pekte videre på en
- Page 55 and 56:
diakonale høgskole og Dronning Mau
- Page 57 and 58:
Blant større fag, fag med over 3 0
- Page 59 and 60:
Tabell 2.5.1 Etterutdanning i regi
- Page 61 and 62:
arbeidsledigheten ned fra 8,1 til 3
- Page 63 and 64:
2.7.2 Utvikling i antall studiepoen
- Page 65 and 66:
Det er vanskelig å isolere de ulik
- Page 67 and 68:
De største prosentvise økningene
- Page 69 and 70:
3. Forskning 3.1 Innledning I dette
- Page 71 and 72:
14 % til ca. 12 %). Vi finner også
- Page 73 and 74:
3.2.2 De vitenskapelige høyskolene
- Page 75 and 76:
nalet ved universitetene og de vite
- Page 77 and 78:
Tabell 3.2.6 Andel kvinner ved de s
- Page 79 and 80:
ligger på 52 % blant høyskolelekt
- Page 81 and 82:
Andelen av førsteamanuenser i 2008
- Page 83 and 84:
Siden det er snakk om svært små t
- Page 85 and 86:
Blant de statlige høyskolene skill
- Page 87 and 88:
har skjedd viktige endringer i løp
- Page 89 and 90:
Programmets første utlysning i 200
- Page 91 and 92:
Figur 3.5.1 De ulike høyskolenes a
- Page 93 and 94:
Stipendiatene inngår aktivt i inst
- Page 95 and 96:
Figur 3.6.1 Doktorgrader 1980-2008
- Page 97 and 98:
Tabell 3.6.4 Doktorgrader 1990-2008
- Page 99 and 100:
Figur 3.6.5 Årsverk stipendiatstil
- Page 101 and 102:
høyere utdanningsinstitusjonene fi
- Page 103 and 104:
viser også på hvilke fagområder
- Page 105 and 106:
Tabell 3.7.2 Stipendiatstillinger f
- Page 107 and 108:
kjønnsfordelingen på fagområdeni
- Page 109 and 110:
Norge har en høyere veksttakt enn
- Page 111 and 112:
Tabell 3.9.2 Antall publikasjonspoe
- Page 113 and 114:
poeng. Dette utgjør bare 1,4 % av
- Page 115 and 116:
Figur 3.9.4 Fordeling på publikasj
- Page 117 and 118:
De tre forskningsutførende sektore
- Page 119 and 120:
Tabell 3.11.1 FoU-utgifter i univer
- Page 121 and 122:
Tabell 3.11.3 Totale FoU-utgifter i
- Page 123 and 124:
Tabell 3.11.6 Totale FoU-utgifter i
- Page 125 and 126:
Tabell 3.11.7a Statstilskudd, EU-mi
- Page 127 and 128:
Statstilskudd EU midler totalt 2007
- Page 129 and 130:
Notatside 129
- Page 131 and 132:
Tabell 3.11.8b Statstilskudd, NFR-m
- Page 133 and 134:
skoler som har store prosentvise en
- Page 135 and 136:
I spørsmål som omhandler forsknin
- Page 137 and 138:
grunnlag for en ”tohattet” iden
- Page 139 and 140:
Forholdet mellom administrative, vi
- Page 141 and 142:
Tabell 3.13.1 Antall publikasjonspo
- Page 143 and 144:
Tabell 3.13.3 EU-tildeling (1000 kr
- Page 145 and 146:
Figur 4.2.1 Prosent utreisende utve
- Page 147 and 148:
Figur 4.2.2 Norske delstudenter i u
- Page 149 and 150:
Utveksling innen ulike studieretnin
- Page 151 and 152:
Tabell 4.2.2 Oversikt over innreise
- Page 153 and 154:
Utvekslingsstudenter samlet ved uli
- Page 155 and 156:
De integrerte læreplanene og krave
- Page 157 and 158:
Figur4.3.1 Norske gradsstudenter i
- Page 159 and 160:
Andelen utlendinger har vært jevnt
- Page 161 and 162:
Tabell 4.3.3 Utenlandske studenter
- Page 163 and 164:
Tabell 4.4.2 Innreisende faglig ans
- Page 165 and 166:
Tabell 4.4.8 Utveksling av faglig a
- Page 167 and 168:
5. Institusjonene og omverdenen 5.1
- Page 169 and 170:
Tabell 5.3.1 viser at de statlige h
- Page 171 and 172:
Tabell 5.3.4 Inntekter til bidrags-
- Page 173 and 174:
Tabell 5.3.6 Driftsinntekter, BOA u
- Page 175 and 176:
enkelte institusjon og i TTO-ene. E
- Page 177 and 178:
Figur 5.4.2 Forskningsbaserte forre
- Page 179 and 180:
Trøndelag og Ålesund). NTNU har r
- Page 181 and 182:
ingen som en passiv respons på lov
- Page 183 and 184:
Universitetet i Tromsø I Tromsø h
- Page 185 and 186:
For det tredje er FoU-virksomheten
- Page 187 and 188:
Boks 5.6.1: Massachusetts Institute
- Page 189 and 190:
Tabell 5.6.3 Empirisk studie som in
- Page 191 and 192:
nyetableringer varierer betydelig.
- Page 193 and 194:
5.6.3 Resultatene i Norge sammenlik
- Page 195 and 196:
Dette forutsetter at innovatørene
- Page 197 and 198:
UiT har også en juriststilling som
- Page 199 and 200:
kapasitet, bruker utredningsressurs
- Page 201 and 202:
esse kan også omfatte infrastruktu
- Page 203 and 204:
Åtte institusjoner har ikke aksjer
- Page 205 and 206:
5.11 Universitetsmuseene 5.11.1 Inn
- Page 207 and 208:
nedgang i andel av samlingene som e
- Page 209 and 210:
til å bringe sine resultater noen
- Page 211 and 212:
ansvar for å føre tilsyn med den
- Page 213 and 214:
De statlige institusjonene rapporte
- Page 215 and 216:
For de statlige høyskolene ligger
- Page 217 and 218:
foreløpige tallene som er levert t
- Page 219 and 220:
gjennomføring av budsjettene i sam
- Page 221 and 222:
omtale av vesentlige avvik mellom p
- Page 223 and 224:
tilgang på velkvalifiserte arbeids
- Page 225 and 226:
systemet var under press både inne
- Page 227 and 228:
7.3 Internasjonale utviklingstrekk
- Page 229 and 230:
Sammenslåingen i universitetssekto
- Page 231 and 232:
7.3.3 Tyskland Fremdyrking av elite
- Page 233 and 234:
styring. Her er nå ansvaret i mye
- Page 235 and 236:
Sørge for at mulighetene ved høye
- Page 237 and 238:
målene en har for høyere utdannin
- Page 239 and 240:
skifter panelene som foretar fagfel
- Page 241 and 242:
Tabell 7.4.2 Jiao Tong University S
- Page 243 and 244:
Legger til rette for sammenligner m
- Page 245 and 246:
antakelser om sektorens videre utvi
- Page 247 and 248:
3. High performance computation ser
- Page 249 and 250:
Hvor godt klarer norske utdannings-
- Page 251 and 252:
Figur 7.6.2 Fremtidig utvikling i a
- Page 253 and 254:
Figur 7.6.4 Fremtidig geografisk fo
- Page 255 and 256:
Nye typer konvergensteknologier På
- Page 257 and 258:
forsknings- og konsulentselskap ute
- Page 259 and 260:
Frølich, N. og Stensaker, B. (2008
- Page 261 and 262:
O'Shea, R. P., Allen, T. J., Cheval
- Page 263:
Zhao, F. (2004): Commercialization
- Page 266 and 267:
Tabell V-3.2a Andel ansatte kvinner
- Page 268 and 269:
Vedlegg 0 Sektormål, virksomhetsm
- Page 270 and 271:
Statlige høyskoler Sektormål 1 H
- Page 272 and 273:
Vitenskapelige høyskoler Sektormå
- Page 274 and 275:
Sektormål 3 Omverdenen Universitet
- Page 276 and 277:
Statlige høyskoler Sektormål 3 H
- Page 278 and 279:
Vitenskapelige høyskoler Sektormå
- Page 280 and 281:
Sektormål 5 Universitetsmuseene Se
- Page 282 and 283:
Private vitenskapelige høyskoler (
- Page 284 and 285:
Tabell V-2.1ff Nye studietilbud ved
- Page 286 and 287:
Høgskolen i Finnmark Oppstart Godk
- Page 288 and 289:
Høgskolen i Lillehammer Oppstart G
- Page 290 and 291:
Høgskolen i Oslo Oppstart Godkjent
- Page 292 and 293:
Høgskolen i Volda Oppstart Godkjen
- Page 294 and 295:
Tabell V-2.2ff Avviklede studietilb
- Page 296 and 297:
Høgskolen i Hedmark Studiepoeng St
- Page 298 and 299:
Høgskolen i Oslo Studiepoeng Studi
- Page 300 and 301:
Høgskolen i Sogn og Fjordane Studi
- Page 302 and 303:
Tabell V-2.3ff Nye studietilbud ved
- Page 304 and 305:
Universitetet i Stavanger Nivåkode
- Page 306 and 307:
Universitetet i Tromsø Studiepoeng
- Page 308 and 309:
Tabell V-2.11f Nye studietilbud ved
- Page 310 and 311:
Tabell V-2.14 Bachelor, aggregerte
- Page 312 and 313:
Tabell V-2.16 Søknader Lavere niv
- Page 314 and 315:
2005 2006 2007 2008 2005 2006 2007
- Page 316 and 317:
Lavere nivå Høyere nivå Integrer
- Page 318 and 319:
Tabell V-2.19 Registrerte studenter
- Page 320 and 321:
Tabell V-2.20 Innvandrere i høyere
- Page 322 and 323:
Tabell V-2.22 Innvandrere i høyere
- Page 324 and 325:
Tabell V-2.24 Ferdig uteksaminerte
- Page 326 and 327:
Tabell V-2.25 Ferdige kandidater (e
- Page 328 and 329:
Tabell V-2.28 Nye studiepoeng (egen
- Page 330 and 331:
Tabell V-2.29 Nye studiepoeng per r
- Page 332 and 333:
Tabell V-2.31 Strykprosent Lavere n
- Page 334 and 335:
Tabell V-2.33 Karaktersnitt for fø
- Page 336 and 337:
Tabell V-2.35 Studenter per undervi
- Page 338 and 339:
Tabell V-2.36 Gjennomføringsgrad i
- Page 340 and 341:
Tabell V-2.37 Karakterfordeling all
- Page 342 and 343:
Tabell V-2.39 Karakterfordeling all
- Page 344 and 345:
Tabell V-2.40 Utvikling i antall be
- Page 346 and 347:
Tabell V-2.41 Ferdige kandidater MN
- Page 348 and 349:
Tabell V-2.44 Aldersmedian 2005 200
- Page 350 and 351:
Vedlegg 3 Forskning 350
- Page 352 and 353:
Universitetet i Agder 2005 2006 200
- Page 354 and 355:
Norges handelshøgskole 2005 2006 2
- Page 356 and 357:
Høgskolen i Bodø 2005 2006 2007 2
- Page 358 and 359:
Høgskolen i Lillehammer 2005 2006
- Page 360 and 361:
Høgskolen i Sogn og Fjordane 2005
- Page 362 and 363:
Høgskolen i Østfold 2005 2006 200
- Page 364 and 365:
Tabell V-3.1e Stillinger ved de Pri
- Page 366 and 367:
Betanien diakonale høgskole 2005 2
- Page 368 and 369:
Lovisenberg diakonale høgskole 200
- Page 370 and 371:
Høgskolen i Bergen Antall 2005 200
- Page 372 and 373:
Høgskolen i Hedmark Antall 2005 20
- Page 374 and 375:
Høgskolen i Oslo Antall 2005 2006
- Page 376 and 377:
Høgskolen i Volda 2005 2006 2007 2
- Page 378 and 379:
Universitetet for miljø- og biovit
- Page 380 and 381:
Tabell V-3.2c Andel ansatte kvinner
- Page 382 and 383:
Kunsthøgskolen i Oslo 2005 2006 20
- Page 384 and 385:
Bergen Arkitekt Skole 2005 2006 200
- Page 386 and 387:
Høgskulen landbruk og bygdenæring
- Page 388 and 389:
Rudolf Steinerhøyskolen 2005 2006
- Page 390 and 391:
Høgskolen i Tromsø 2005 2006 2007
- Page 392 and 393:
Handelshøyskolen BI 2005 2006 2007
- Page 394 and 395: Forskerutdanning på institusjonsni
- Page 396 and 397: Universitetet i Agder 2005 2006 200
- Page 398 and 399: Universitetet i Oslo 2005 2006 2007
- Page 400 and 401: Universitetet i Tromsø 2005 2006 2
- Page 402 and 403: Norges idrettshøgskole 2005 2006 2
- Page 404 and 405: Høgskolen i Molde 2005 2006 2007 2
- Page 406 and 407: Tabell V-3.8 Årsverk i stipendiats
- Page 408 and 409: Tabell V-3.10 Gjennomstrømning -
- Page 410 and 411: Tabell V-3.12 Gjennomstrømning - A
- Page 412 and 413: Tabell V-3.14 Fordeling av nye stip
- Page 414 and 415: Tabell V-3.16 Doktorgrader ved Univ
- Page 416 and 417: Tabell V-3.18 Doktorgrader ved Univ
- Page 418 and 419: FoU-utgifter og finansiering Tabell
- Page 420 and 421: UMB Totalt Grunnbudsjett fin. liv k
- Page 422 and 423: Publisering Tabell V-3.27ff Oversik
- Page 424 and 425: 2006 Publikasjonspoeng Endring poen
- Page 426 and 427: Tabell V-3.28 Andel av forfatterand
- Page 428 and 429: Tabell V-3.30 Forfatterandeler - ut
- Page 430 and 431: Tabell V-4.1 Utreisende utvekslings
- Page 432 and 433: Tabell V-4.3 Innreisende utveksling
- Page 434 and 435: Tabell V-4.8 Prosent innreisende st
- Page 436 and 437: Tabell V-4.12 Utvekslingsfaktor av
- Page 438 and 439: Høgskolen i Nesna Utvekslingsstude
- Page 440 and 441: Tabell V-4.15ff Utvekslingsfaktor i
- Page 442 and 443: Tabell V-4.17 Utvekslingsfaktor og
- Page 446 and 447: Vedlegg 5 Institusjonene og omverde
- Page 448 and 449: Bokført med Samlet pålydende stat
- Page 450 and 451: Høgskolen i Lillehammer Emne Studi
- Page 452 and 453: Emne Studieprogramtilknytning Studi
- Page 454 and 455: Universitetet i Oslo Emne Avlagte s
- Page 456 and 457: Tabell V-6-1 Styre- og ledelsesmode
- Page 458 and 459: Tabell V-6.2b Sykefravær i prosent
- Page 460 and 461: Tabell V-6.3 Statstilskudd 2006 200
- Page 462 and 463: Tabell V-6.5 Lønnskostnader 2007 2
- Page 464 and 465: Tabell V-6.7 Avregning, resultat op
- Page 466 and 467: Tabell V-6.9 Virksomhetskapital 200
- Page 468 and 469: Tabell V-6.13 Spesifisering av avse
- Page 470 and 471: Tabell V-7.1 Oversikt over institus
- Page 474: Utgitt av: Kunnskapsdepartementet D