

Biomechanics and Medicine in Swimming XI
Biomechanics and Medicine in Swimming XI
Biomechanics and Medicine in Swimming XI

You also want an ePaper? Increase the reach of your titles
YUMPU automatically turns print PDFs into web optimized ePapers that Google loves.
<strong>Biomechanics</strong><strong>and</strong>medic<strong>in</strong>e<strong>in</strong>swimm<strong>in</strong>gXi<br />
Regression Analysis Model Applied to Age-Group<br />
Swimmers: Study of Stroke Rate, Stroke Length <strong>and</strong><br />
Stroke Index<br />
Morales, e., Arellano, r., Femia, P., Mercade, J.<br />
University of Granada, Spa<strong>in</strong><br />
This <strong>in</strong>vestigation aimed to develop a regression model of the K<strong>in</strong>ematics<br />
Characteristics (KC) evolution <strong>in</strong> a large sample of regional<br />
age-group Spanish swimmers. Subjects were 280 regional swimmers<br />
selected from different clubs. The 50 m time, Stroke rate (SR), Stroke<br />
length (SL) <strong>and</strong> Stroke Index (SI) were used for analysis. Inverse function<br />
approximation of the race times by age (AGE) <strong>and</strong> gender (GEN)<br />
was carried out. Quadratic function approximation of the SL <strong>and</strong> SI<br />
by ag<strong>in</strong>g was carried out. L<strong>in</strong>eal function by ag<strong>in</strong>g was def<strong>in</strong>ed for ST.<br />
Furthermore, the analysis regression of KC for age <strong>and</strong> genders were calculated<br />
respectively. 50 m times were different between genders. There<br />
is a tendency to improve the parameters SL <strong>and</strong> SI with age <strong>in</strong> both<br />
genders. SR does not show a clear trend <strong>and</strong> has an irregular behaviour.<br />
Key words: stroke rate, stroke length, stroke <strong>in</strong>dex, regression analysis,<br />
age-group.<br />
IntroductIon<br />
The swimmer´s time obta<strong>in</strong>ed after perform<strong>in</strong>g a competitive event can<br />
be considered as important <strong>in</strong>formation to help the coach<strong>in</strong>g process<br />
that follows the competitive performance. The dynamic process of tra<strong>in</strong><strong>in</strong>g<br />
needs as much <strong>in</strong>formation as possible from that performance. This<br />
<strong>in</strong>formation will help the coach to monitor the tra<strong>in</strong><strong>in</strong>g program.<br />
The Race Component (RC) Time to be <strong>in</strong>clude <strong>in</strong> the analysis of<br />
swimm<strong>in</strong>g performance dur<strong>in</strong>g <strong>in</strong>ternational swimm<strong>in</strong>g competition<br />
(Hay,Guimaraes, & Grimston, 1983) <strong>and</strong> it is very important to now<br />
the follow of race. In order to improve the swimmer´s efficiency stroke<br />
rate, stroke length <strong>and</strong> stroke <strong>in</strong>dex to be <strong>in</strong>clude <strong>in</strong> the analysis of competition.<br />
Technical performance <strong>in</strong> cyclic activities <strong>and</strong>, more specifically,<br />
swimm<strong>in</strong>g performance (Hay, 2002) has traditionally been assessed<br />
by analysis the changes <strong>in</strong> <strong>and</strong> management of velocity, stroke rate <strong>and</strong><br />
stroke length (Graig, & Perdergast, 1979; Pai, Hay & Wilson, 1984;<br />
Kenndy, Brown, Chegarlur & Nelson, 1990; Chegarlur & Brown, 1992;<br />
Chollet, Pelayo, Tourny, & Sidney, 1996). Several groups of researchers<br />
have analysed the technical <strong>and</strong> k<strong>in</strong>ematics characteristics (KC), stroke<br />
rate (SR), stroke lengh (SL) <strong>and</strong> stroke <strong>in</strong>dex (SI), dur<strong>in</strong>g <strong>in</strong>ternational<br />
competitions to determ<strong>in</strong>e their relationship with performance.<br />
Some studies have been published where regression equations were<br />
applied <strong>in</strong> the analysis of RC obta<strong>in</strong>ed <strong>in</strong> different competitions (Absaliamov<br />
& Timakovoy, 1090; Arellano, Brown, Cappaert & Nelson,<br />
1996; Nomura, 2006). The study aim was to develop a regression model<br />
of the KC evolution <strong>in</strong> a large sample of regional age-group Spanish<br />
swimmers.<br />
Method<br />
The subjects were 280 swimmers (162 males <strong>and</strong> 118 females) regional<br />
swimmers. The age of these subjects ranged from 9 to 22 years.<br />
The procedures that have been used to record the 50 m time <strong>and</strong> k<strong>in</strong>ematics<br />
characteristics obta<strong>in</strong>ed by swimmers dur<strong>in</strong>g the performance<br />
test of 50 m freestyle were: a) references were put on the swimm<strong>in</strong>g pool<br />
at the distances selected (5, 10, 15 <strong>and</strong> 20 m) to know when the head<br />
crossed this l<strong>in</strong>e; b) the 50m trials were recorded by five video cameras<br />
connected to a m<strong>in</strong>i DV video recorder through a video-timer <strong>and</strong> video<br />
selector; c) the images from the first two video cameras were mixed to<br />
130<br />
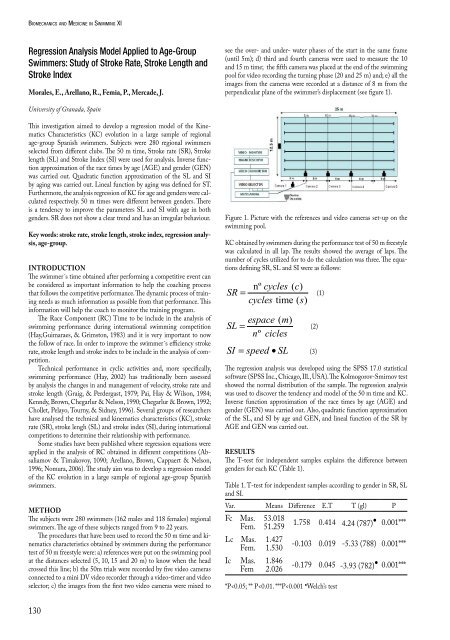
see the over- <strong>and</strong> under- water phases of the start <strong>in</strong> the same frame<br />
(until 5m); d) third <strong>and</strong> fourth cameras were used to measure the 10<br />
<strong>and</strong> 15 m time; the fifth camera was placed at the end of the swimm<strong>in</strong>g<br />
pool for video record<strong>in</strong>g the turn<strong>in</strong>g phase (20 <strong>and</strong> 25 m) <strong>and</strong>; e) all the<br />
images from the cameras were recorded at a distance of 8 m from the<br />
perpendicular plane of the swimmer’s displacement (see figure 1).<br />
Figure 1. Picture with the references <strong>and</strong> video cameras set-up on the<br />
swimm<strong>in</strong>g pool.<br />
KC obta<strong>in</strong>ed by swimmers dur<strong>in</strong>g the performance test of 50 m freestyle<br />
was calculated <strong>in</strong> all lap. The results showed the average of laps. The<br />
number of cycles utilized for to do the calculation was three. The equations<br />
def<strong>in</strong><strong>in</strong>g SR, SL <strong>and</strong> SI were as follows:<br />
nº cycles ( c)<br />
SR<br />
cycles time ( s)<br />
SL<br />
= (1)<br />
espace ( m)<br />
nº cicles<br />
= (2)<br />
SI = speed • SL (3)<br />
The regression analysis was developed us<strong>in</strong>g the SPSS 17.0 statistical<br />
software (SPSS Inc., Chicago, Ill., USA). The Kolmogorov-Smirnov test<br />
showed the normal distribution of the sample. The regression analysis<br />
was used to discover the tendency <strong>and</strong> model of the 50 m time <strong>and</strong> KC.<br />
Inverse function approximation of the race times by age (AGE) <strong>and</strong><br />
gender (GEN) was carried out. Also, quadratic function approximation<br />
of the SL, <strong>and</strong> SI by age <strong>and</strong> GEN, <strong>and</strong> l<strong>in</strong>eal function of the SR by<br />
AGE <strong>and</strong> GEN was carried out.<br />
results<br />
The T-test for <strong>in</strong>dependent samples expla<strong>in</strong>s the difference between<br />
genders for each KC (Table 1).<br />
Table 1. T-test for <strong>in</strong>dependent samples accord<strong>in</strong>g to gender <strong>in</strong> SR, SL<br />
<strong>and</strong> SI.<br />
Var. Means Difference E.T T (gl) P<br />
Fc Mas.<br />
Fem.<br />
Lc Mas.<br />
Fem.<br />
Ic Mas.<br />
Fem<br />
53.018<br />
51.259<br />
1.427<br />
1.530<br />
1.846<br />
2.026<br />
*P


