Biomechanics and Medicine in Swimming XI
Biomechanics and Medicine in Swimming XI
Biomechanics and Medicine in Swimming XI
Create successful ePaper yourself
Turn your PDF publications into a flip-book with our unique Google optimized e-Paper software.
<strong>Biomechanics</strong><strong>and</strong>medic<strong>in</strong>e<strong>in</strong>swimm<strong>in</strong>gXi<br />
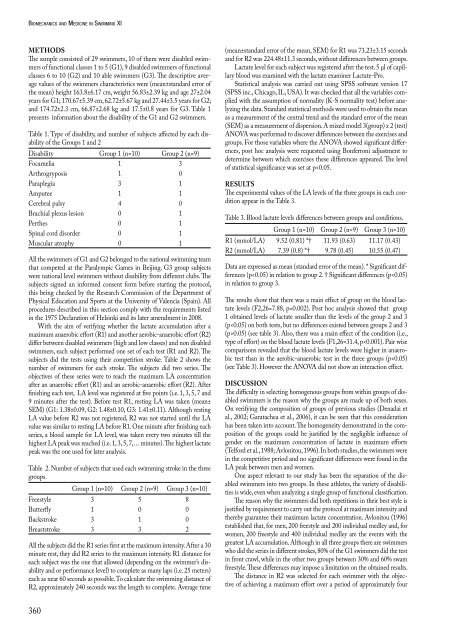
Methods<br />
The sample consisted of 29 swimmers, 10 of them were disabled swimmers<br />
of functional classes 1 to 5 (G1), 9 disabled swimmers of functional<br />
classes 6 to 10 (G2) <strong>and</strong> 10 able swimmers (G3). The descriptive average<br />
values of the swimmers characteristics were (mean±st<strong>and</strong>ard error of<br />
the mean) height 163.8±6.17 cm, weight 56.83±2.39 kg <strong>and</strong> age 27±2.04<br />
years for G1; 170.67±5.39 cm, 62.72±5.67 kg <strong>and</strong> 27.44±3.5 years for G2;<br />
<strong>and</strong> 174.72±2.3 cm, 66.87±2.68 kg <strong>and</strong> 17.5±0.8 years for G3. Table 1<br />
presents <strong>in</strong>formation about the disability of the G1 <strong>and</strong> G2 swimmers.<br />
Table 1. Type of disability, <strong>and</strong> number of subjects affected by each disability<br />
of the Groups 1 <strong>and</strong> 2<br />
Disability Group 1 (n=10) Group 2 (n=9)<br />
Focamelia 1 3<br />
Arthrogryposis 1 0<br />
Paraplegia 3 1<br />
Amputee 1 1<br />
Cerebral palsy 4 0<br />
Brachial plexus lesion 0 1<br />
Perthes 0 1<br />
Sp<strong>in</strong>al cord disorder 0 1<br />
Muscular atrophy 0 1<br />
All the swimmers of G1 <strong>and</strong> G2 belonged to the national swimm<strong>in</strong>g team<br />
that competed at the Paralympic Games <strong>in</strong> Beij<strong>in</strong>g. G3 group subjects<br />
were national level swimmers without disability from different clubs. The<br />
subjects signed an <strong>in</strong>formed consent form before start<strong>in</strong>g the protocol,<br />
this be<strong>in</strong>g checked by the Research Commission of the Department of<br />
Physical Education <strong>and</strong> Sports at the University of Valencia (Spa<strong>in</strong>). All<br />
procedures described <strong>in</strong> this section comply with the requirements listed<br />
<strong>in</strong> the 1975 Declaration of Hels<strong>in</strong>ki <strong>and</strong> its later amendment <strong>in</strong> 2008.<br />
With the aim of verify<strong>in</strong>g whether the lactate accumulation after a<br />
maximum anaerobic effort (R1) <strong>and</strong> another aerobic-anaerobic effort (R2)<br />
differ between disabled swimmers (high <strong>and</strong> low classes) <strong>and</strong> non disabled<br />
swimmers, each subject performed one set of each test (R1 <strong>and</strong> R2). The<br />
subjects did the tests us<strong>in</strong>g their competition stroke. Table 2 shows the<br />
number of swimmers for each stroke. The subjects did two series. The<br />
objectives of these series were to reach the maximum LA concentration<br />
after an anaerobic effort (R1) <strong>and</strong> an aerobic-anaerobic effort (R2). After<br />
f<strong>in</strong>ish<strong>in</strong>g each test, LA level was registered at five po<strong>in</strong>ts (i.e. 1, 3, 5, 7 <strong>and</strong><br />
9 m<strong>in</strong>utes after the test). Before test R1, rest<strong>in</strong>g LA was taken (mean±<br />
SEM) (G1: 1.38±0.09, G2: 1.48±0.10, G3: 1.41±0.11). Although rest<strong>in</strong>g<br />
LA value before R2 was not registered, R2 was not started until the LA<br />
value was similar to rest<strong>in</strong>g LA before R1. One m<strong>in</strong>ute after f<strong>in</strong>ish<strong>in</strong>g each<br />
series, a blood sample for LA level, was taken every two m<strong>in</strong>utes till the<br />
highest LA peak was reached (i.e. 1, 3, 5, 7,… m<strong>in</strong>utes). The highest lactate<br />
peak was the one used for later analysis.<br />
Table 2. Number of subjects that used each swimm<strong>in</strong>g stroke <strong>in</strong> the three<br />
groups.<br />
Group 1 (n=10) Group 2 (n=9) Group 3 (n=10)<br />
Freestyle 3 5 8<br />
Butterfly 1 0 0<br />
Backstroke 3 1 0<br />
Breaststroke 3 3 2<br />
All the subjects did the R1 series first at the maximum <strong>in</strong>tensity. After a 30<br />
m<strong>in</strong>ute rest, they did R2 series to the maximum <strong>in</strong>tensity. R1 distance for<br />
each subject was the one that allowed (depend<strong>in</strong>g on the swimmer’s disability<br />
<strong>and</strong> or performance level) to complete as many laps (i.e. 25 meters)<br />
each as near 60 seconds as possible. To calculate the swimm<strong>in</strong>g distance of<br />
R2, approximately 240 seconds was the length to complete. Average time<br />
360<br />
(mean±st<strong>and</strong>ard error of the mean, SEM) for R1 was 73.23±3.15 seconds<br />
<strong>and</strong> for R2 was 224.48±11.3 seconds, without differences between groups.<br />
Lactate level for each subject was registered after the test. 5 µl of capillary<br />
blood was exam<strong>in</strong>ed with the lactate exam<strong>in</strong>er Lactate-Pro.<br />
Statistical analysis was carried out us<strong>in</strong>g SPSS software version 17<br />
(SPSS <strong>in</strong>c., Chicago, IL, USA). It was checked that all the variables complied<br />
with the assumption of normality (K-S normality test) before analyz<strong>in</strong>g<br />
the data. St<strong>and</strong>ard statistical methods were used to obta<strong>in</strong> the mean<br />
as a measurement of the central trend <strong>and</strong> the st<strong>and</strong>ard error of the mean<br />
(SEM) as a measurement of dispersion. A mixed model 3(group) x 2 (test)<br />
ANOVA was performed to discover differences between the exercises <strong>and</strong><br />
groups. For those variables where the ANOVA showed significant differences,<br />
post hoc analysis were requested us<strong>in</strong>g Bonferroni adjustment to<br />
determ<strong>in</strong>e between which exercises these differences appeared. The level<br />
of statistical significance was set at p


