Biomechanics and Medicine in Swimming XI
Biomechanics and Medicine in Swimming XI
Biomechanics and Medicine in Swimming XI
You also want an ePaper? Increase the reach of your titles
YUMPU automatically turns print PDFs into web optimized ePapers that Google loves.
Performance Level Differences <strong>in</strong> Swimm<strong>in</strong>g:<br />
Relative Contributions of Strength <strong>and</strong> Technique<br />
havriluk, r.<br />
Swimm<strong>in</strong>g Technology Research, Tallahassee, USA<br />
The purpose of this study was to compare the relative contributions of<br />
strength (measured by force, F) <strong>and</strong> technique (measured by the active<br />
drag coefficient, Cd) to swimm<strong>in</strong>g performance. Male (n = 40) <strong>and</strong> female<br />
(n = 40) swimmers were tested with Aquanex+Video swimm<strong>in</strong>g<br />
four trials (one of each stroke) over a 20 m course. Underwater video,<br />
h<strong>and</strong> force data, <strong>and</strong> swim time were collected over the last 10 m. The<br />
magnitude of the difference between faster <strong>and</strong> slower swimmers <strong>in</strong><br />
both F <strong>and</strong> Cd was calculated as an effect size (ES). The mean ES for the<br />
Cd was almost double the ES for F, <strong>in</strong>dicat<strong>in</strong>g that the advantage faster<br />
swimmers have over slower swimmers is derived more from technique<br />
than strength. Coaches can use this <strong>in</strong>formation to implement the most<br />
appropriate <strong>in</strong>terventions for cont<strong>in</strong>ued improvement.<br />
Key words: strength, technique, h<strong>and</strong> force, active drag coefficient,<br />
biomechanics<br />
IntroductIon<br />
The drag equation expla<strong>in</strong>s swimm<strong>in</strong>g performance as: v ≈ √(F/C d ),<br />
where v is swimm<strong>in</strong>g velocity, F is force, <strong>and</strong> C d is the active drag coefficient.<br />
Consistent with this equation, previous research found that v <strong>in</strong>creases<br />
with √F (Havriluk, 2004), <strong>and</strong> that faster swimmers have a lower<br />
C d than slower swimmers (Havriluk, 2003). Other test<strong>in</strong>g protocols (e.g.<br />
Takagi et al., 1983; Toussa<strong>in</strong>t et al., 1988; White & Stager, 2004) also<br />
reported significant relationships of F <strong>and</strong> C d with v.<br />
The importance of both strength (as measured by F) <strong>and</strong> technique<br />
(as measured by C d ) to swimm<strong>in</strong>g performance (as measured by<br />
v) is well established both theoretically <strong>and</strong> empirically. The relative contributions<br />
of F <strong>and</strong> C d to performance, however, have not been determ<strong>in</strong>ed.<br />
The purpose of this study was to determ<strong>in</strong>e how faster swimmers<br />
perform better than slower swimmers due to the relative contributions<br />
of strength (F) <strong>and</strong> technique (C d ), so that coaches can implement the<br />
most appropriate <strong>in</strong>terventions for cont<strong>in</strong>ued improvement.<br />
Method<br />
Swimmers from 21 teams volunteered to participate <strong>in</strong> the study. Male<br />
(n = 40) <strong>and</strong> female (n = 40) swimmers were tested with Aquanex+Video,<br />
swimm<strong>in</strong>g four trials (one of each stroke) over a 20 m course. The st<strong>and</strong>ard<br />
Aquanex test<strong>in</strong>g protocol as described <strong>in</strong> previous research (e.g.<br />
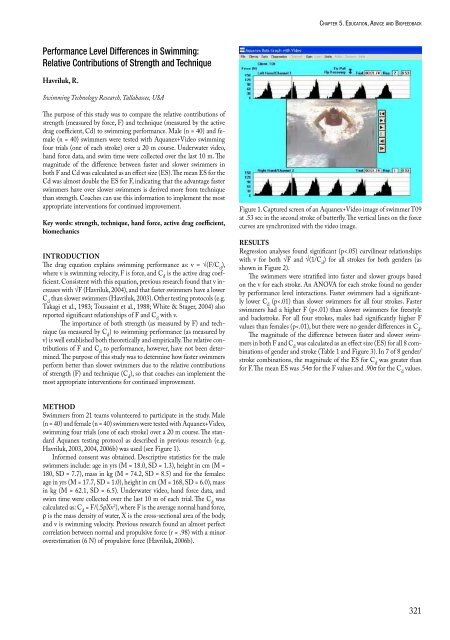
Havriluk, 2003, 2004, 2006b) was used (see Figure 1).<br />
Informed consent was obta<strong>in</strong>ed. Descriptive statistics for the male<br />
swimmers <strong>in</strong>clude: age <strong>in</strong> yrs (M = 18.0, SD = 1.3), height <strong>in</strong> cm (M =<br />
180, SD = 7.7), mass <strong>in</strong> kg (M = 74.2, SD = 8.5) <strong>and</strong> for the females:<br />
age <strong>in</strong> yrs (M = 17.7, SD = 1.0), height <strong>in</strong> cm (M = 168, SD = 6.0), mass<br />
<strong>in</strong> kg (M = 62.1, SD = 6.5). Underwater video, h<strong>and</strong> force data, <strong>and</strong><br />
swim time were collected over the last 10 m of each trial. The C d was<br />
calculated as: C d = F/(.5ρXv 2 ), where F is the average normal h<strong>and</strong> force,<br />
r is the mass density of water, X is the cross-sectional area of the body,<br />
<strong>and</strong> v is swimm<strong>in</strong>g velocity. Previous research found an almost perfect<br />
correlation between normal <strong>and</strong> propulsive force (r = .98) with a m<strong>in</strong>or<br />
overestimation (6 N) of propulsive force (Havriluk, 2006b).<br />
chaPter5.education,advice<strong>and</strong>BiofeedBack<br />
Figure 1. Captured screen of an Aquanex+Video image of swimmer T09<br />
at .53 sec <strong>in</strong> the second stroke of butterfly. The vertical l<strong>in</strong>es on the force<br />
curves are synchronized with the video image.<br />
results<br />
Regression analyses found significant (p


