

Biomechanics and Medicine in Swimming XI
Biomechanics and Medicine in Swimming XI
Biomechanics and Medicine in Swimming XI

You also want an ePaper? Increase the reach of your titles
YUMPU automatically turns print PDFs into web optimized ePapers that Google loves.
<strong>Biomechanics</strong><strong>and</strong>medic<strong>in</strong>e<strong>in</strong>swimm<strong>in</strong>gXi<br />
swimmers, very long tra<strong>in</strong><strong>in</strong>g <strong>in</strong>tervals (repetitions of 500 m) swum at<br />
lactate threshold would lead to greater oxygen uptake, higher stroke rate,<br />
<strong>and</strong> shorter stroke length than those observed dur<strong>in</strong>g <strong>in</strong>tervals of shorter<br />
distance (repetitions of 100 m).<br />
Methods<br />
Seven long-distance male swimmers compet<strong>in</strong>g at the national <strong>and</strong> <strong>in</strong>ternational<br />
level participated <strong>in</strong> this study.<br />
Table 1. Individual anthropometric characteristics <strong>and</strong> tra<strong>in</strong><strong>in</strong>g content.<br />
S<br />
260<br />
Age<br />
(Y)<br />
Weight<br />
(kg)<br />
Height<br />
(cm)<br />
v LT-<br />
(km)<br />
v LT+<br />
(km)<br />
1 23 61 176 2100 380<br />
2 22 74 188 1900 290<br />
3 20 75 185 2050 370<br />
4 21 69 175 2200 303<br />
5 20 76 182 2200 320<br />
6 29 69 174 2350 352<br />
7 20 76 182 2200 330<br />
M 22 71 180 2143 335<br />
SE 3.2 5.5 5.4 143 34<br />
v LT-, annual tra<strong>in</strong><strong>in</strong>g volume at low <strong>in</strong>tensity below the lactate threshold.<br />
v LT+, annual tra<strong>in</strong><strong>in</strong>g volume at high <strong>in</strong>tensity above the lactate<br />
threshold .<br />
All participants completed three experimental sessions <strong>in</strong> a 50-m open<br />
pool (26°C) dur<strong>in</strong>g one week of st<strong>and</strong>ardized tra<strong>in</strong><strong>in</strong>g. The first tra<strong>in</strong><strong>in</strong>g<br />
test consisted <strong>in</strong> a progressive <strong>in</strong>cremental test to exhaustion. The<br />
other tests were two r<strong>and</strong>omized <strong>in</strong>terval sessions – 6 x 500 m (IT6x500 )<br />
or 30x100 m (IT30x100 ) – performed at the velocity correspond<strong>in</strong>g to<br />
lactate threshold (vLT). Dur<strong>in</strong>g each IT session, the time spent at 90%<br />
above 2 O V� max <strong>and</strong> 90% above maximal heart rate (HRpeak ) were determ<strong>in</strong>ed<br />
retrospectively. The <strong>in</strong>cremental test <strong>in</strong>cluded five consecutive<br />
300-m swims separated by 30s of rest. The speed of each <strong>in</strong>crement was<br />
determ<strong>in</strong>ed from the best performance of each swimmer <strong>in</strong> the 400m<br />
freestyle event measured dur<strong>in</strong>g the month preced<strong>in</strong>g the test. The<br />
speed for the first 300-m was 30-s slower than the average 300-m pace<br />
over the 400-m best performance <strong>and</strong> this time was then reduced by<br />
<strong>in</strong>crements of 5 s for each consecutive 300-m until the f<strong>in</strong>al 300-m at<br />
the swimmer’s fastest speed. Swimm<strong>in</strong>g speeds were monitored with<br />
Aquapacer ‘Solo’ (Challenge <strong>and</strong> Response, Inverurie, UK) so that each<br />
swimmer could match auditory signals with visual markers positioned<br />
every 12.5 m along the border of the pool. Blood lactate level (expressed<br />
<strong>in</strong> mM/L) was determ<strong>in</strong>ed from a f<strong>in</strong>gertip blood sample which was<br />
analyzed immediately us<strong>in</strong>g a portable lactate analyzer (Lactate Pro,<br />
Arkray, Japan). Breath-by-breath respiratory data were collected with<br />
a portable gas analyzer (Cosmed K4b2, Rome, Italy) connected to an<br />
Aquatra<strong>in</strong>er snorkel (Cosmed, Rome, Italy). Heart rate (HR) was recorded<br />
us<strong>in</strong>g a belt system (Polar Electro, F<strong>in</strong>l<strong>and</strong>). The lactate threshold<br />
(LT) was determ<strong>in</strong>ed by two <strong>in</strong>dependent observers us<strong>in</strong>g the first<br />
<strong>in</strong>flexion method applied to the l<strong>in</strong>ear relationship between lactate level<br />
<strong>and</strong> velocity associated with a 1mmol·l-1 <strong>in</strong>crease <strong>in</strong> serum lactate above<br />
the basel<strong>in</strong>e level. HRpeak (expressed <strong>in</strong> beats·m<strong>in</strong>-1 ) was def<strong>in</strong>ed as the<br />
mean highest HR measured over 15s dur<strong>in</strong>g the test.<br />
Dur<strong>in</strong>g the <strong>in</strong>terval tra<strong>in</strong><strong>in</strong>g (IT), the swimmers were kept <strong>in</strong>formed<br />
of their velocity us<strong>in</strong>g the protocol described above. Swimmers were<br />
encouraged orally to susta<strong>in</strong> their velocity despite <strong>in</strong>creas<strong>in</strong>g exhaustion<br />
throughout the set. Swim times (s) were systematically recorded for<br />
each 500 <strong>and</strong> 100-m repetition. Because the swimmers were wear<strong>in</strong>g a<br />
snorkel, they used open turns. Dur<strong>in</strong>g a pilot run, the time needed to execute<br />
a turn with the snorkel was estimated <strong>in</strong>dividually with an average<br />
time of 1±0.37 s compared with a conventional tumble turn. The velocity<br />
(m·s-1 ) was calculated by divid<strong>in</strong>g the length of each repetition (100-m<br />
or 500-m) by the time with <strong>in</strong>dividual correction for number of turns.<br />
The actual velocity for each 5x100m workout was averaged for a comparison<br />
with IT6x500 . Mean stroke rate (SR) (cycle·m<strong>in</strong>-1 ) was measured<br />
<strong>in</strong> a 25-m central zone us<strong>in</strong>g a base 3 chronometer (Seiko, base 3, Japan).<br />
Stroke length (SL) was calculated for each 50 m by divid<strong>in</strong>g the mean<br />
velocity by SR. Expired gases collected breath-by-breath were monitored<br />
cont<strong>in</strong>uously <strong>and</strong> recorded every 5 s. VO2 �<br />
mean for the two IT6x500 <strong>and</strong> IT30*100 sessions were calculated as was the time of swimm<strong>in</strong>g above<br />
90% of VO2 � max (T>90%). Breath samples were then averaged over 30<br />
s <strong>and</strong> 2 O V� peak <strong>and</strong> HR peak were measured <strong>and</strong> expressed <strong>in</strong> % of VO2 �<br />
max. Serum lactate level was measured at the end of eat IT session.<br />
results<br />
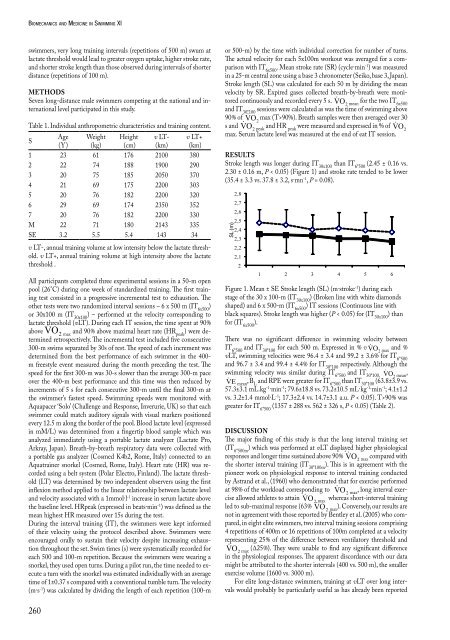
Stroke length was longer dur<strong>in</strong>g IT 30x100 than IT 6*500 (2.45 ± 0.16 vs.<br />
2.30 ± 0.16 m, P < 0.05) (Figure 1) <strong>and</strong> stroke rate tended to be lower<br />
(35.4 ± 3.3 vs. 37.8 ± 3.2, s·mn -1 , P = 0.08).<br />
SL (m)<br />
2,8<br />
2,7<br />
2,6<br />
2,5<br />
2,4<br />
2,3<br />
2,2<br />
2,1<br />
2<br />
1 2 3 4 5 6<br />
Figure 1. Mean ± SE Stroke length (SL) (m·stroke -1 ) dur<strong>in</strong>g each<br />
stage of the 30 x 100-m (IT 30x100 ) (Broken l<strong>in</strong>e with white diamonds<br />
shaped) <strong>and</strong> 6 x 500-m (IT 6x500 ) IT sessions (Cont<strong>in</strong>uous l<strong>in</strong>e with<br />
black squares). Stroke length was higher (P < 0.05) for (IT 30x100 ) than<br />
for (IT 6x500 ).<br />
There was no significant difference <strong>in</strong> swimm<strong>in</strong>g velocity between<br />
IT6*500 <strong>and</strong> IT30*100 for each 500 m. Expressed <strong>in</strong> % v VO2 �<br />
max <strong>and</strong> %<br />
vLT, swimm<strong>in</strong>g velocities were 96.4 ± 3.4 <strong>and</strong> 99.2 ± 3.6% for IT6*500 <strong>and</strong> 96.7 ± 3.4 <strong>and</strong> 99.4 ± 4.4% for IT30*100 respectively. Although the<br />
swimm<strong>in</strong>g velocity was similar dur<strong>in</strong>g IT6*500 <strong>and</strong> IT30*100, VO2 �<br />
mean ,<br />
VE �<br />
mean , BL <strong>and</strong> RPE were greater for IT6*500 than IT30*100 (63.8±3.9 vs.<br />
57.3±3.1 mL.kg-1 ·m<strong>in</strong>-1 ; 79.6±18.8 vs. 73.2±10.5 mL·kg-1 ·m<strong>in</strong>-1 ; 4.1±1.2<br />
vs. 3.2±1.4 mmol·L-1 ; 17.3±2.4 vs. 14.7±3.1 a.u. P < 0.05). T>90% was<br />
greater for IT6*500 (1357 ± 288 vs. 562 ± 326 s, P < 0.05) (Table 2).<br />
dIscussIon<br />
The major f<strong>in</strong>d<strong>in</strong>g of this study is that the long <strong>in</strong>terval tra<strong>in</strong><strong>in</strong>g set<br />
(IT6*500m ) which was performed at vLT displayed higher physiological<br />
responses <strong>and</strong> longer time susta<strong>in</strong>ed above 90% VO2 �<br />
max compared with<br />
the shorter <strong>in</strong>terval tra<strong>in</strong><strong>in</strong>g (IT30*100m ). This is <strong>in</strong> agreement with the<br />
pioneer work on physiological response to <strong>in</strong>terval tra<strong>in</strong><strong>in</strong>g conducted<br />
by Astr<strong>and</strong> et al., (1960) who demonstrated that for exercise performed<br />
at 98% of the workload correspond<strong>in</strong>g to VO 2<br />
�<br />
max , long <strong>in</strong>terval exercise<br />
allowed athletes to atta<strong>in</strong> VO 2<br />
�<br />
max whereas short-<strong>in</strong>terval tra<strong>in</strong><strong>in</strong>g<br />
led to sub-maximal response (63% VO 2<br />
�<br />
max ). Conversely, our results are<br />
not <strong>in</strong> agreement with those reported by Bentley et al. (2005) who compared,<br />
<strong>in</strong> eight elite swimmers, two <strong>in</strong>terval tra<strong>in</strong><strong>in</strong>g sessions compris<strong>in</strong>g<br />
4 repetitions of 400m or 16 repetitions of 100m completed at a velocity<br />
represent<strong>in</strong>g 25% of the difference between ventilatory threshold <strong>and</strong><br />
VO2 �<br />
max (Δ25%). They were unable to f<strong>in</strong>d any significant difference<br />
<strong>in</strong> the physiological responses. The apparent discordance with our data<br />
might be attributed to the shorter <strong>in</strong>tervals (400 vs. 500 m), the smaller<br />
exercise volume (1600 vs. 3000 m).<br />
For elite long-distance swimmers, tra<strong>in</strong><strong>in</strong>g at vLT over long <strong>in</strong>tervals<br />
would probably be particularly useful as has already been reported


