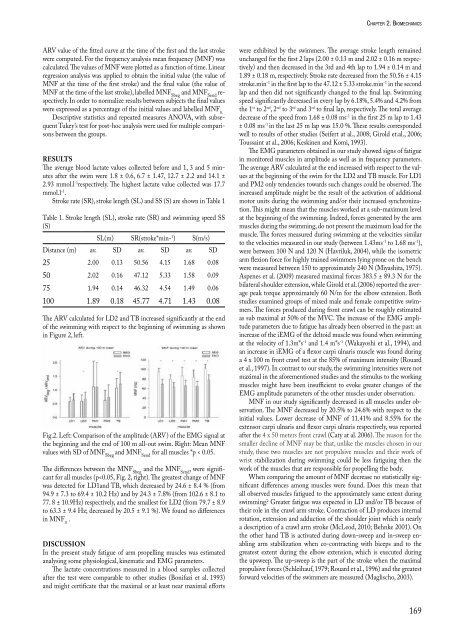
ARV value of the fitted curve at the time of the first <strong>and</strong> the last stroke were computed. For the frequency analysis mean frequency (MNF) was calculated. The values of MNF were plotted as a function of time. L<strong>in</strong>ear regression analysis was applied to obta<strong>in</strong> the <strong>in</strong>itial value (the value of MNF at the time of the first stroke) <strong>and</strong> the f<strong>in</strong>al value (the value of MNF at the time of the last stroke), labelled MNF Sbeg <strong>and</strong> MNF Send respectively. In order to normalize results between subjects the f<strong>in</strong>al values were expressed as a percentage of the <strong>in</strong>itial values <strong>and</strong> labelled MNF n. Descriptive statistics <strong>and</strong> repeated measures ANOVA, with subsequent Tukey’s test for post-hoc analysis were used for multiple comparisons between the groups. results The average blood lactate values collected before <strong>and</strong> 1, 3 <strong>and</strong> 5 m<strong>in</strong>utes after the swim were 1.8 ± 0.6, 6.7 ± 1.47, 12.7 ± 2.2 <strong>and</strong> 14.1 ± 2.93 mmol.l -1 respectively. The highest lactate value collected was 17.7 mmol.l -1 . Stroke rate (SR), stroke length (SL) <strong>and</strong> SS (S) are shown <strong>in</strong> Table 1 Table 1. Stroke length (SL), stroke rate (SR) <strong>and</strong> swimm<strong>in</strong>g speed SS (S) SL(m) SR(stroke*m<strong>in</strong>-1 ) S(m/s) Distance (m) av. SD av. SD av. SD 25 2.00 0.13 50.56 4.15 1.68 0.08 50 2.02 0.16 47.12 5.33 1.58 0.09 75 1.94 0.14 46.32 4.54 1.49 0.06 100 1.89 0.18 45.77 4.71 1.43 0.08 The ARV calculated for LD2 <strong>and</strong> TB <strong>in</strong>creased significantly at the end of the swimm<strong>in</strong>g with respect to the beg<strong>in</strong>n<strong>in</strong>g of swimm<strong>in</strong>g as shown <strong>in</strong> Figure 2, left. Fig.2. Left: Comparison of the amplitude (ARV) of the EMG signal at the beg<strong>in</strong>n<strong>in</strong>g <strong>and</strong> the end of 100 m all-out swim. Right: Mean MNF values with SD of MNF Sbeg <strong>and</strong> MNF Send for all muscles *p < 0.05. The differences between the MNF Sbeg <strong>and</strong> the MNF Send , were significant for all muscles (p
<strong>Biomechanics</strong><strong>and</strong>medic<strong>in</strong>e<strong>in</strong>swimm<strong>in</strong>gXi conclusIon By us<strong>in</strong>g EMG amplitude <strong>and</strong> frequency analysis, the progression of muscle fatigue <strong>in</strong> arm propell<strong>in</strong>g muscles was clearly detected. No differences <strong>in</strong> the relative decrease of MNF between the muscles under observation were found. This suggests that these muscles fatigued to approximately the same extent dur<strong>in</strong>g all-out crawl, which may present significant <strong>in</strong>formation for the coaches <strong>in</strong> order to plan strength workouts. reFerences Aspenes, S., Kjendlie, P.L., Hoff, J., & Helgerud, J. (2009). Comb<strong>in</strong>ed strength <strong>and</strong> endurance tra<strong>in</strong><strong>in</strong>g <strong>in</strong> competitive swimmers. J Sports Sci Med 8, 357-365. Aujouannet, Y.A., Bonifazi, M., H<strong>in</strong>tzy, F., Vuillerme, N., & Rouard, A.H. (2006). Effects of a high-<strong>in</strong>tensity swim test on k<strong>in</strong>ematic parameters <strong>in</strong> high-level athletes. Appl Physiol Nutr Metabol 31:150-158. Bonifazi, M., Martelli, G., Marugo, L., Sardela, F., & Carli, G.(1993). Blood lactate acumulation <strong>in</strong> top level swimmers follow<strong>in</strong>g competition. J Sports Med Phys Fitness, 33(1) 13-18. Caty, V.Y., Rouard, A.H., H<strong>in</strong>tzy, F., Aujouannet, Y.A., Mol<strong>in</strong>ari, F., & Knaflitz, M.(2006).Time-frequency parameters of wrist muscles EMG after an exhaustive freestyle test. Revista Portuguesa de Ciencias do Desporto 6:28-30. Clarys, J. P., Massez, C., Van der Broeck, M., Piette, G., & Robeaux, R.(1983). Total Telemetric Surface EMG of the Front Crawl. International Series on <strong>Biomechanics</strong> 5, 4A, p.p. 951-959. Human K<strong>in</strong>etics Publishers. Girold, S., Calmels, P., Maur<strong>in</strong>, D., Milhau, N., & Chatard, J.C. (2006). Assisted <strong>and</strong> resisted spr<strong>in</strong>t tra<strong>in</strong><strong>in</strong>g <strong>in</strong> swimm<strong>in</strong>g. J Strength Condit Res 20(3),547-554. Havriluk, R. (2004). H<strong>and</strong> force <strong>and</strong> swimm<strong>in</strong>g velocity. In: XVth Federation Internationale de Natation World Congress. Indianapolis. http:// swimm<strong>in</strong>gtechnology.com/FINA2004.htm Kesk<strong>in</strong>en, K.L., & Komi, P.V. (1993). Strok<strong>in</strong>g characteristics of front crawl swimm<strong>in</strong>g dur<strong>in</strong>g exercise. J Appl Biomech 9:219–226. Maglischo, E. W. (2003). Swimm<strong>in</strong>g fastest. Champa<strong>in</strong>, IL: Human k<strong>in</strong>etics. Merletti, R., Lo Conte, R., & Orizio, C. (1991). Indices of muscle fatigue. J Electromyogr K<strong>in</strong>esiol 1:20-33. Miyashita, M. (1975). Arm action <strong>in</strong> the crawl stroke. In Lewillie L, Clarys JP (ed) Swimm<strong>in</strong>g II University Park Press, Baltimore, 167– 173. Rouard, A.H., Billat, R.P., Deschodt, V., & Clarys, J.P. (1997) Muscular activations dur<strong>in</strong>g repetitions of scull<strong>in</strong>g movements up to exhaustion <strong>in</strong> swimm<strong>in</strong>g. Arch Physiol Biochem 105:655-662. Rouard, A.H., Schleihauf, R.E., & Troup, J.P. (1996). H<strong>and</strong> forces <strong>and</strong> phases <strong>in</strong> freestyle stroke. In: Troup JP, Holl<strong>and</strong>er AP, Strasse D, Trappe SW, Cappaert JM, Trappe TA (ed) <strong>Biomechanics</strong> <strong>and</strong> <strong>Medic<strong>in</strong>e</strong> <strong>in</strong> swimm<strong>in</strong>g VII, Chapman & Hall, London, UK, 34-42. Seifert, L., Chollet, D., & Chatard, J.C. (2008) K<strong>in</strong>ematic changes dur<strong>in</strong>g a 100-m front crawl: effects of performance level <strong>and</strong> gender. Med Sci Sports Exerc 40(3):591. Schleihauf,R.E. (1979). A hydrodynamic analysis of swimm<strong>in</strong>g propulsion. In: Teraud J, Bed<strong>in</strong>gfield EW (eds) Swimm<strong>in</strong>g III, International Series of Sport Sciences. University Park Press, BaltimoreSeifert L, Chollet D, Chatard JC (2008) K<strong>in</strong>ematic changes dur<strong>in</strong>g a 100-m front crawl: effects of performance level <strong>and</strong> gender. <strong>Medic<strong>in</strong>e</strong> & Science <strong>in</strong> Sports & Exercise 40(3):591. Toussa<strong>in</strong>t, H.M., Carol, A., Kranenborg, H., & Truijens, M.J. (2006). Effect of fatigue on strok<strong>in</strong>g characteristics <strong>in</strong> an arms-only 100-m front-crawl race. Medic Sci Sports Exerc 38:1635-42. Wakayoshi, K., Moritani, T., Mutoh, Y., Miyashita, M. (1994). Electromyographic evidence of selective muscle fatigue dur<strong>in</strong>g competitive swimm<strong>in</strong>g. In: Miyashita M, Mutoh Y, Richardson AB (eds) <strong>Medic<strong>in</strong>e</strong> <strong>and</strong> Sport Science 39:16-23. 170 Comparison Among Three Types of Relay Starts <strong>in</strong> Competitive Swimm<strong>in</strong>g takeda, t. 1 , takagi, h. 1 , tsubakimoto, s. 1 1 University of Tsukuba, Tsukuba, JAPAN The purpose of the present study was to evaluate the effectiveness of no-step, s<strong>in</strong>gle-step <strong>and</strong> double-step relay starts for swimmers. Eight male collegiate swimmers participated <strong>in</strong> the present study. For each type of start, each swimmer performed six trials of relay starts with maximum effort. Ground reaction forces were measured us<strong>in</strong>g a Kistler force plate to calculate the take-off velocity <strong>and</strong> take-off angle from the force data. Relay times were measured by count<strong>in</strong>g the number of video frames obta<strong>in</strong>ed by a high-speed camera. No significant difference <strong>in</strong> the horizontal take-off velocity was observed. The relay times decreased significantly <strong>in</strong> the order nostep, s<strong>in</strong>gle-step <strong>and</strong> double-step starts (P < 0.05). Eight trials among all the trials for the step starts resulted <strong>in</strong> <strong>in</strong>correct foot placement on the edge of the block. No-step starts resulted <strong>in</strong> better performance than step starts. Key words: step start, relay time, performance IntroductIon In relay events, it is possible to record a time on the start<strong>in</strong>g block (block time) of zero second. The block time is the time that elapses between the <strong>in</strong>stant at which the start signal is given <strong>and</strong> the <strong>in</strong>stant at which the swimmer’s foot leaves the start<strong>in</strong>g block. In relay events, the first swimmer beg<strong>in</strong>s the race when the start signal is given, <strong>and</strong> swimmers to follow start after the previous swimmer has reached his or her f<strong>in</strong>ish<strong>in</strong>g po<strong>in</strong>t. Therefore, the time on the block of the swimmers to follow should ideally correspond to the <strong>in</strong>stant at which the previous swimmer reaches his or her f<strong>in</strong>ish<strong>in</strong>g po<strong>in</strong>t. The block time of an <strong>in</strong>dividual <strong>in</strong> regular events ranges from approximately 0.6 to 0.8 s, as reported <strong>in</strong> previous studies (Issur<strong>in</strong> & Verbitsky 2003, Takeda & Nomura 2006). The results of relay events depend upon the technique adopted while chang<strong>in</strong>g swimmers dur<strong>in</strong>g a relay. The sum of the block times <strong>in</strong> the three changeover swimmers represents approximately 2.4 s. There are two k<strong>in</strong>ds of start<strong>in</strong>g techniques <strong>in</strong> relay events. Their starts generate greater horizontal velocity upon take-off from the start<strong>in</strong>g block (McLean et al. 2000). The sw<strong>in</strong>g start <strong>in</strong>volves the sw<strong>in</strong>g of an arm. On the other h<strong>and</strong>, the step start <strong>in</strong>volves tak<strong>in</strong>g one or two steps before jump<strong>in</strong>g with both feet from the block. There have been a few studies on relay starts (Gambrel et al. 1991, McLean et al. 2000). McLean et al. (2000) <strong>in</strong>vestigated the effectiveness of step starts <strong>in</strong> the case of collegiate male swimmers who were given <strong>in</strong>struction on step starts over a four-week period. These researchers reported that step starts were effective relay starts. However, they did not consider the relay time when evaluat<strong>in</strong>g the start performance. The step start is considered a more difficult technique than a start <strong>in</strong>volv<strong>in</strong>g no steps (no-step start) because swimmers often place their foot on the edge of the start<strong>in</strong>g block by mistake. The swimmer cannot generate satisfactory horizontal velocity on the block if the foot placement is <strong>in</strong>correct. It is necessary to determ<strong>in</strong>e the best relay start by tak<strong>in</strong>g <strong>in</strong>to consideration the time taken to change swimmers dur<strong>in</strong>g the relay <strong>and</strong> the difficulty each swimmer faces <strong>in</strong> the step start. The purpose of the present study was to evaluate the effectiveness of the three types of relay starts <strong>in</strong> order to determ<strong>in</strong>e the relay start performance while consider<strong>in</strong>g the relay time <strong>and</strong> the difficulty faced dur<strong>in</strong>g step starts. Methods Eight well-tra<strong>in</strong>ed male college swimmers participated <strong>in</strong> this study. Their mean height, mean body weight <strong>and</strong> mean age were 177.9 ± 5.7
- Page 1 and 2:
Biomechanics and Medicine in Swimmi
- Page 3 and 4:
Bibliographic information: Biomecha
- Page 5 and 6:
Biomechanicsandmedicinein
- Page 7 and 8:
Biomechanicsandmedicinein
- Page 9 and 10:
Biomechanicsandmedicinein
- Page 11 and 12:
Biomechanicsandmedicinein
- Page 13 and 14:
Biomechanicsandmedicinein
- Page 15 and 16:
Biomechanicsandmedicinein
- Page 17 and 18:
Biomechanicsandmedicinein
- Page 19 and 20:
Biomechanicsandmedicinein
- Page 21 and 22:
Biomechanicsandmedicinein
- Page 23 and 24:
Biomechanicsandmedicinein
- Page 25 and 26:
Biomechanicsandmedicinein
- Page 27 and 28:
Biomechanicsandmedicinein
- Page 29 and 30:
Biomechanicsandmedicinein
- Page 31 and 32:
Biomechanicsandmedicinein
- Page 33 and 34:
Biomechanicsandmedicinein
- Page 35 and 36:
Biomechanicsandmedicinein
- Page 37 and 38:
Biomechanicsandmedicinein
- Page 39 and 40:
Biomechanicsandmedicinein
- Page 41 and 42:
Biomechanicsandmedicinein
- Page 43 and 44:
Biomechanicsandmedicinein
- Page 45 and 46:
Biomechanicsandmedicinein
- Page 47 and 48:
Biomechanicsandmedicinein
- Page 49 and 50:
Biomechanicsandmedicinein
- Page 51 and 52:
Biomechanicsandmedicinein
- Page 53 and 54:
Biomechanicsandmedicinein
- Page 55 and 56:
Biomechanicsandmedicinein
- Page 57 and 58:
Biomechanicsandmedicinein
- Page 59 and 60:
Biomechanicsandmedicinein
- Page 61 and 62:
Biomechanicsandmedicinein
- Page 63 and 64:
Biomechanicsandmedicinein
- Page 65 and 66:
Biomechanicsandmedicinein
- Page 67 and 68:
Biomechanicsandmedicinein
- Page 69 and 70:
Biomechanicsandmedicinein
- Page 71 and 72:
Biomechanicsandmedicinein
- Page 73 and 74:
Biomechanicsandmedicinein
- Page 75 and 76:
Biomechanicsandmedicinein
- Page 77 and 78:
Biomechanicsandmedicinein
- Page 79 and 80:
Biomechanicsandmedicinein
- Page 81 and 82:
Figure 1. General biomechanical par
- Page 83 and 84:
Biomechanicsandmedicinein
- Page 85 and 86:
Biomechanicsandmedicinein
- Page 87 and 88:
Biomechanicsandmedicinein
- Page 89 and 90:
Biomechanicsandmedicinein
- Page 91 and 92:
Biomechanicsandmedicinein
- Page 93 and 94:
Biomechanicsandmedicinein
- Page 95 and 96:
Biomechanicsandmedicinein
- Page 97 and 98:
Biomechanicsandmedicinein
- Page 99 and 100:
Biomechanicsandmedicinein
- Page 101 and 102:
Biomechanicsandmedicinein
- Page 103 and 104:
Biomechanicsandmedicinein
- Page 105 and 106:
Biomechanicsandmedicinein
- Page 107 and 108:
Biomechanicsandmedicinein
- Page 109 and 110:
Biomechanicsandmedicinein
- Page 111 and 112:
Biomechanicsandmedicinein
- Page 113 and 114:
Biomechanicsandmedicinein
- Page 115 and 116:
Biomechanicsandmedicinein
- Page 117 and 118:
Biomechanicsandmedicinein
- Page 119 and 120: Biomechanicsandmedicinein
- Page 121 and 122: Biomechanicsandmedicinein
- Page 123 and 124: Biomechanicsandmedicinein
- Page 125 and 126: Biomechanicsandmedicinein
- Page 127 and 128: Biomechanicsandmedicinein
- Page 129 and 130: Biomechanicsandmedicinein
- Page 131 and 132: Biomechanicsandmedicinein
- Page 133 and 134: Biomechanicsandmedicinein
- Page 135 and 136: Biomechanicsandmedicinein
- Page 137 and 138: Biomechanicsandmedicinein
- Page 139 and 140: Biomechanicsandmedicinein
- Page 141 and 142: Biomechanicsandmedicinein
- Page 143 and 144: Biomechanicsandmedicinein
- Page 145 and 146: Biomechanicsandmedicinein
- Page 147 and 148: Biomechanicsandmedicinein
- Page 149 and 150: Biomechanicsandmedicinein
- Page 151 and 152: Biomechanicsandmedicinein
- Page 153 and 154: Biomechanicsandmedicinein
- Page 155 and 156: Biomechanicsandmedicinein
- Page 157 and 158: Biomechanicsandmedicinein
- Page 159 and 160: Biomechanicsandmedicinein
- Page 161 and 162: Biomechanicsandmedicinein
- Page 163 and 164: Biomechanicsandmedicinein
- Page 165 and 166: Biomechanicsandmedicinein
- Page 167 and 168: Biomechanicsandmedicinein
- Page 169: Biomechanicsandmedicinein
- Page 173 and 174: Biomechanicsandmedicinein
- Page 175 and 176: Biomechanicsandmedicinein
- Page 177 and 178: Biomechanicsandmedicinein
- Page 179 and 180: Biomechanicsandmedicinein
- Page 181 and 182: Biomechanicsandmedicinein
- Page 183 and 184: Biomechanicsandmedicinein
- Page 185 and 186: Biomechanicsandmedicinein
- Page 187 and 188: Biomechanicsandmedicinein
- Page 189 and 190: Biomechanicsandmedicinein
- Page 191 and 192: Biomechanicsandmedicinein
- Page 193 and 194: Biomechanicsandmedicinein
- Page 195 and 196: Biomechanicsandmedicinein
- Page 197 and 198: Biomechanicsandmedicinein
- Page 199 and 200: Biomechanicsandmedicinein
- Page 201 and 202: Biomechanicsandmedicinein
- Page 203 and 204: Biomechanicsandmedicinein
- Page 205 and 206: Biomechanicsandmedicinein
- Page 207 and 208: Biomechanicsandmedicinein
- Page 209 and 210: Biomechanicsandmedicinein
- Page 211 and 212: Biomechanicsandmedicinein
- Page 213 and 214: Biomechanicsandmedicinein
- Page 215 and 216: Biomechanicsandmedicinein
- Page 217 and 218: average VO2 measured during resting
- Page 219 and 220: Biomechanicsandmedicinein
- Page 221 and 222:
Fourteen highly trained male swimme
- Page 223 and 224:
Biomechanicsandmedicinein
- Page 225 and 226:
Biomechanicsandmedicinein
- Page 227 and 228:
Biomechanicsandmedicinein
- Page 229 and 230:
Biomechanicsandmedicinein
- Page 231 and 232:
Biomechanicsandmedicinein
- Page 233 and 234:
Biomechanicsandmedicinein
- Page 235 and 236:
Biomechanicsandmedicinein
- Page 237 and 238:
Biomechanicsandmedicinein
- Page 239 and 240:
Biomechanicsandmedicinein
- Page 241 and 242:
Biomechanicsandmedicinein
- Page 243 and 244:
Biomechanicsandmedicinein
- Page 245 and 246:
Biomechanicsandmedicinein
- Page 247 and 248:
Biomechanicsandmedicinein
- Page 249 and 250:
Biomechanicsandmedicinein
- Page 251 and 252:
Biomechanicsandmedicinein
- Page 253 and 254:
Biomechanicsandmedicinein
- Page 255 and 256:
Biomechanicsandmedicinein
- Page 257 and 258:
Biomechanicsandmedicinein
- Page 259 and 260:
Biomechanicsandmedicinein
- Page 261 and 262:
Biomechanicsandmedicinein
- Page 263 and 264:
Biomechanicsandmedicinein
- Page 265 and 266:
Biomechanicsandmedicinein
- Page 267 and 268:
Figure 2. Repeatability of the LTin
- Page 269 and 270:
Biomechanicsandmedicinein
- Page 271 and 272:
Biomechanicsandmedicinein
- Page 273 and 274:
Biomechanicsandmedicinein
- Page 275 and 276:
Biomechanicsandmedicinein
- Page 277 and 278:
Biomechanicsandmedicinein
- Page 279 and 280:
Biomechanicsandmedicinein
- Page 281 and 282:
Biomechanicsandmedicinein
- Page 283 and 284:
Biomechanicsandmedicinein
- Page 285 and 286:
Biomechanicsandmedicinein
- Page 287 and 288:
Biomechanicsandmedicinein
- Page 289 and 290:
Biomechanicsandmedicinein
- Page 291 and 292:
Biomechanicsandmedicinein
- Page 293 and 294:
Biomechanicsandmedicinein
- Page 295 and 296:
Biomechanicsandmedicinein
- Page 297 and 298:
Biomechanicsandmedicinein
- Page 299 and 300:
-ARM * 5 Biomechanicsandmedic
- Page 301 and 302:
Biomechanicsandmedicinein
- Page 303 and 304:
Biomechanicsandmedicinein
- Page 305 and 306:
Biomechanicsandmedicinein
- Page 307 and 308:
Biomechanicsandmedicinein
- Page 309 and 310:
Biomechanicsandmedicinein
- Page 311 and 312:
Biomechanicsandmedicinein
- Page 313 and 314:
Biomechanicsandmedicinein
- Page 315 and 316:
Biomechanicsandmedicinein
- Page 317 and 318:
Biomechanicsandmedicinein
- Page 319 and 320:
• Without restriction; • Blinde
- Page 321 and 322:
Biomechanicsandmedicinein
- Page 323 and 324:
Biomechanicsandmedicinein
- Page 325 and 326:
Biomechanicsandmedicinein
- Page 327 and 328:
Biomechanicsandmedicinein
- Page 329 and 330:
Biomechanicsandmedicinein
- Page 331 and 332:
Biomechanicsandmedicinein
- Page 333 and 334:
Biomechanicsandmedicinein
- Page 335 and 336:
Biomechanicsandmedicinein
- Page 337 and 338:
Biomechanicsandmedicinein
- Page 339 and 340:
Biomechanicsandmedicinein
- Page 341 and 342:
Biomechanicsandmedicinein
- Page 343 and 344:
Biomechanicsandmedicinein
- Page 345 and 346:
Biomechanicsandmedicinein
- Page 347 and 348:
Biomechanicsandmedicinein
- Page 349 and 350:
Biomechanicsandmedicinein
- Page 351 and 352:
Biomechanicsandmedicinein
- Page 353 and 354:
Biomechanicsandmedicinein
- Page 355 and 356:
Biomechanicsandmedicinein
- Page 357 and 358:
Biomechanicsandmedicinein
- Page 359 and 360:
etween experimental groups and cont
- Page 361 and 362:
Biomechanicsandmedicinein
- Page 363 and 364:
Biomechanicsandmedicinein
- Page 365 and 366:
Biomechanicsandmedicinein
- Page 367 and 368:
Biomechanicsandmedicinein
- Page 369 and 370:
Biomechanicsandmedicinein
- Page 371 and 372:
Biomechanicsandmedicinein
- Page 373 and 374:
Biomechanicsandmedicinein
- Page 375 and 376:
Biomechanicsandmedicinein
- Page 377 and 378:
Biomechanicsandmedicinein
- Page 379 and 380:
Biomechanicsandmedicinein
- Page 381 and 382:
Biomechanicsandmedicinein
- Page 383 and 384:
Biomechanicsandmedicinein
- Page 385 and 386:
Biomechanicsandmedicinein
- Page 387 and 388:
Biomechanicsandmedicinein
- Page 389 and 390:
Biomechanicsandmedicinein
- Page 391:
Pahlen Norge AS Pahlen Norge AS Cha