

Biomechanics and Medicine in Swimming XI
Biomechanics and Medicine in Swimming XI
Biomechanics and Medicine in Swimming XI

You also want an ePaper? Increase the reach of your titles
YUMPU automatically turns print PDFs into web optimized ePapers that Google loves.
<strong>Biomechanics</strong><strong>and</strong>medic<strong>in</strong>e<strong>in</strong>swimm<strong>in</strong>gXi<br />
Hydrodynamic Characterization of the First <strong>and</strong><br />
Second Glide Positions of the Underwater Stroke<br />
Technique <strong>in</strong> Breaststroke<br />
costa, l. 1 ; ribeiro, J. 1 ; Figueiredo, P. 1 ; Fern<strong>and</strong>es, r.J. 1 ; Mar<strong>in</strong>ho,<br />
d. 2,3 ; silva, A.J. 3,4 ; rouboa, A. 3,4 ; Vilas-Boas, J.P. 1 ; Machado,<br />
l. 1<br />
1 University of Porto, Faculty of Sport, Cifi2d, Porto, Portugal<br />
2 University of Beira Interior, Covilhã, Portugal<br />
3 Research Center In Sports, Health <strong>and</strong> Human Development, Vila Real,<br />
Portugal<br />
4 University of Trás-os-Montes <strong>and</strong> Alto Douro, Vila Real, Portugal<br />
The aim of the present study was to characterize two different ventral<br />
glide positions, both used after start <strong>and</strong> turns: the arms extended at the<br />
front, <strong>and</strong> the arms extended along the trunk, respectively the first <strong>and</strong><br />
the second glide positions of the breaststroke underwater stroke. Inverse<br />
Dynamics was used for obta<strong>in</strong><strong>in</strong>g the passive drag <strong>and</strong> the drag coefficient,<br />
based upon the velocity to time curve of each glide, monitored<br />
through a swim-meter. The first glide position presented lower values<br />
of drag <strong>and</strong> drag coefficient, manag<strong>in</strong>g to reach higher velocities. The<br />
cross sectional area (planimetry) values were lower for first glide position<br />
<strong>in</strong> comparison with the second one (759.95 ±124.12 cm2 vs. 814.46 ±<br />
111.23 cm2). These results po<strong>in</strong>t out the need of technical evaluation<br />
<strong>and</strong> control <strong>in</strong> order to reduce drag dur<strong>in</strong>g swimm<strong>in</strong>g performance.<br />
KeY Words: swimm<strong>in</strong>g, breaststroke, passive drag, drag coefficient,<br />
glid<strong>in</strong>g position<br />
IntroductIon<br />
In swimm<strong>in</strong>g the total event time is determ<strong>in</strong>ed by the start, swim, turn<br />
<strong>and</strong> f<strong>in</strong>ish partial times (Halj<strong>and</strong> <strong>and</strong> Saagpakk, 1994). Starts <strong>and</strong> turns<br />
appear to be a significant part of the total swimm<strong>in</strong>g event time (Vilas-<br />
Boas <strong>and</strong> Fern<strong>and</strong>es, 2003). Chatard et al. (1990) stated that the glid<strong>in</strong>g<br />
phase after starts <strong>and</strong> turns corresponds to 10 to 25% of the total<br />
event time (depend<strong>in</strong>g on events <strong>and</strong> the length of the swimm<strong>in</strong>g pool).<br />
D’Acquisto et al. (1988) showed that, dur<strong>in</strong>g the breaststroke events, the<br />
glid<strong>in</strong>g phases represent 44% of the total swimm<strong>in</strong>g time. These authors<br />
showed that the glid<strong>in</strong>g phase dist<strong>in</strong>guishes elite from good level breaststroke<br />
swimmers, with higher glid<strong>in</strong>g time for the elite swimmers. Race<br />
analysis suggested that rather than the start technique used by swimmers;<br />
it is the position under the water that mostly determ<strong>in</strong>es the success of the<br />
start (Cossor <strong>and</strong> Mason, 2001). Therefore, it is essential to analyse <strong>and</strong><br />
underst<strong>and</strong> this phase. The passive drag of swimmers mov<strong>in</strong>g underwater<br />
<strong>in</strong> a streaml<strong>in</strong>ed position has been measured experimentally (Clarys, 1979;<br />
Kolmogorov et al., 1997; Lyttle et al., 2000; Toussa<strong>in</strong>t et al., 2004; Vilas-<br />
Boas et al., <strong>in</strong> press). However, there are other glid<strong>in</strong>g phases <strong>in</strong> which the<br />
swimmers assume a prone position but with the arms extended at the side<br />
of the trunk, as <strong>in</strong> the second glide position after the breaststroke underwater<br />
arm stroke. To our knowledge, these two glide positions were compared<br />
experimentally only by Vilas-Boas et al. (<strong>in</strong> press), <strong>and</strong> numerically<br />
by Mar<strong>in</strong>ho et al. (2009). In both cases, the glides were compared <strong>in</strong> common<br />
velocities, not consider<strong>in</strong>g the total range of velocities at which they<br />
are usually performed. The aim of the present study was to experimentally<br />
characterize the first <strong>and</strong> second glid<strong>in</strong>g positions of the breaststroke underwater<br />
stroke used after starts <strong>and</strong> turns at the total range of velocities<br />
commonly performed, consider<strong>in</strong>g: (i) glid<strong>in</strong>g velocity (v); (ii) body cross<br />
sectional area (S); (iii) drag coefficient (C D ), <strong>and</strong> (iv) passive drag (D).<br />
Methods<br />
Six Portuguese national level male swimmers (18.2 ± 4.0 years old, 178.2<br />
± 9.0 cm of height <strong>and</strong> 64.4 ± 11.4 kg of body mass) participated <strong>in</strong> this<br />
62<br />
study. Test<strong>in</strong>g sessions were conducted <strong>in</strong> a 25 m pool, 2 m deep, with water<br />
temperature at 27.5 ºC. It was used a similar methodology to the described <strong>in</strong><br />
Vilas-Boas et al. (<strong>in</strong> press), namely the S determ<strong>in</strong>ation us<strong>in</strong>g planimetry, <strong>and</strong><br />
the passive drag assessed through <strong>in</strong>verse dynamics based upon the velocity to<br />
time (v (t) ) curve of each glide, monitored through a swim-meter (Lima et al.<br />
2006). Acceleration (a) was obta<strong>in</strong>ed through the numerical derivative of the<br />
velocity curve. The drag force was computed us<strong>in</strong>g the expression:<br />
D = m . a . (1)<br />
To quantify the drag coefficient, the follow<strong>in</strong>g equation was used, assum<strong>in</strong>g<br />
water density (ρ) as 1000 kg/m3 :<br />
C D = 2 D / ρ S v 2 (2)<br />
Each swimmer performed 3 repetitions of the breaststroke underwater stroke,<br />
at maximal <strong>in</strong>tensity (2 m<strong>in</strong> of <strong>in</strong>terval). Dur<strong>in</strong>g the rest <strong>in</strong>terval, swimmers<br />
received proper feedback <strong>in</strong> order to improve their performance. The video<br />
images <strong>and</strong> data process<strong>in</strong>g (v (t) curves <strong>and</strong> acceleration to time curves representations)<br />
of the first <strong>and</strong> second glide of the underwater breaststroke were<br />
obta<strong>in</strong>ed accord<strong>in</strong>g to Vilas-Boas et al. (<strong>in</strong> press). Not all swimmers atta<strong>in</strong>ed<br />
all velocity values, be<strong>in</strong>g reta<strong>in</strong>ed the v values (<strong>in</strong>dependently <strong>in</strong> each glide)<br />
for which there were values from at least three swimmers. The processes of D<br />
<strong>and</strong> C D calculations were described also <strong>in</strong> Vilas-Boas et al. (<strong>in</strong> press).<br />
results<br />
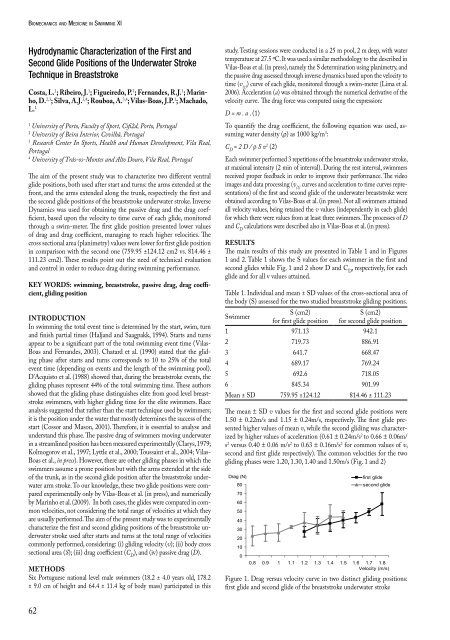
The ma<strong>in</strong> results of this study are presented <strong>in</strong> Table 1 <strong>and</strong> <strong>in</strong> Figures<br />
1 <strong>and</strong> 2. Table 1 shows the S values for each swimmer <strong>in</strong> the first <strong>and</strong><br />
second glides while Fig. 1 <strong>and</strong> 2 show D <strong>and</strong> C D , respectively, for each<br />
glide <strong>and</strong> for all v values atta<strong>in</strong>ed.<br />
Table 1. Individual <strong>and</strong> mean ± SD values of the cross-sectional area of<br />
the body (S) assessed for the two studied breaststroke glid<strong>in</strong>g positions.<br />
Swimmer<br />
S (cm2)<br />
for first glide position<br />
S (cm2)<br />
for second glide position<br />
1 971.13 942.1<br />
2 719.73 886.91<br />
3 641.7 668.47<br />
4 689.17 769.24<br />
5 692.6 718.05<br />
6 845.34 901.99<br />
Mean ± SD 759.95 ±124.12 814.46 ± 111.23<br />
The mean ± SD v values for the first <strong>and</strong> second glide positions were<br />
1.50 ± 0.22m/s <strong>and</strong> 1.15 ± 0.24m/s, respectively. The first glide presented<br />
higher values of mean v, while the second glid<strong>in</strong>g was characterized<br />
by higher values of acceleration (0.61 ± 0.24m/s 2 to 0.66 ± 0.06m/<br />
s 2 versus 0.40 ± 0.06 m/s 2 to 0.63 ± 0.16m/s 2 for common values of v,<br />
second <strong>and</strong> first glide respectively). The common velocities for the two<br />
glid<strong>in</strong>g phases were 1.20, 1.30, 1.40 <strong>and</strong> 1.50m/s (Fig. 1 <strong>and</strong> 2)<br />
Drag (N) first glide<br />
80<br />
second glide<br />
70<br />
60<br />
50<br />
40<br />
30<br />
20<br />
10<br />
0<br />
0.8 0.9 1 1.1 1.2 1.3 1.4 1.5 1.6 1.7 1.8<br />
Velocity (m/s)<br />
Figure 1. Drag versus velocity curve <strong>in</strong> two dist<strong>in</strong>ct glid<strong>in</strong>g positions:<br />
first glide <strong>and</strong> second glide of the breaststroke underwater stroke


