

Biomechanics and Medicine in Swimming XI
Biomechanics and Medicine in Swimming XI
Biomechanics and Medicine in Swimming XI

You also want an ePaper? Increase the reach of your titles
YUMPU automatically turns print PDFs into web optimized ePapers that Google loves.
for displac<strong>in</strong>g the body over a given unit of distance (Zamparo et al, 2005).<br />
Furthermore, it is accepted as an important bioenergetical determ<strong>in</strong>ant<br />
of swimm<strong>in</strong>g performance (Wakayoshi et al, 1995; Kjendlie et al., 2004;<br />
Fern<strong>and</strong>es et al., 2006). However, the body of scientific literature needs<br />
approaches on the relationships between the IdC <strong>and</strong> the C <strong>in</strong> try<strong>in</strong>g to<br />
underst<strong>and</strong> how these two variables may be connected. The present study<br />
aimed at assess<strong>in</strong>g relationships between the IdC <strong>and</strong> the C <strong>in</strong> front crawl,<br />
especially at <strong>in</strong>tensities rang<strong>in</strong>g between ~70 % <strong>and</strong> 100% of the maximal<br />
oxygen consumption ( V � O 2 max). We hypothesised that if velocity is<br />
controlled, IdC <strong>and</strong> C are <strong>in</strong>versely related.<br />
Methods<br />
Seven high-level swimmers (17.0 ± 1.8 years; 168.0 ± 8.8 cm; 58.4 ± 8.2<br />
kg) participant <strong>in</strong> national swimm<strong>in</strong>g championships were tested. Mean<br />
(± SD) ma<strong>in</strong> physiological characteristics were: 18.0 (6.9) % of fat mass,<br />
54.9 (10.1) ml.kg -1 .m<strong>in</strong> -1 of V � O 2 max <strong>and</strong> 7.5 (2.4) of blood lactate<br />
concentrations ([La - ]) at <strong>in</strong>tensities correspond<strong>in</strong>g to V � O 2 max. In an<br />
<strong>in</strong>door 25 m swimm<strong>in</strong>g pool, the participants performed an <strong>in</strong>termittent<br />
<strong>in</strong>cremental protocol, with <strong>in</strong>crements of 0.05 m·s -1 each 200 m stage (<strong>and</strong><br />
30 s <strong>in</strong>tervals), until exhaustion (Fern<strong>and</strong>es et al., 2003). Initial velocity<br />
was established accord<strong>in</strong>g to the <strong>in</strong>dividual level of fitness <strong>and</strong> was set<br />
at the swimmer’s <strong>in</strong>dividual performance on the 400 m freestyle m<strong>in</strong>us<br />
seven <strong>in</strong>crements of velocity. Swimm<strong>in</strong>g velocity was controlled us<strong>in</strong>g a<br />
visual pacer (TAR 1.1, GBK-electronics, Aveiro, Portugal) with successive<br />
flash<strong>in</strong>g lights, 2.5 m apart, on the bottom of the pool.<br />
V � O 2 was measured through direct breath-by-breath oximetry (K4<br />
b 2 , Cosmed, Rome, Italy) connected to the swimmer by a respiratory snorkel<br />
<strong>and</strong> valve system (Kesk<strong>in</strong>en et al., 2003). Capillary blood samples (25<br />
µl) for [La - ] analysis were collected from the earlobe at rest, <strong>in</strong> the 30 s rest<br />
<strong>in</strong>terval, at the end of exercise <strong>and</strong> dur<strong>in</strong>g the recovery period (YSI1500L-<br />
Sport auto-analyser, Yellow Spr<strong>in</strong>gs Incorporated, Ohio, USA). The C was<br />
calculated by divid<strong>in</strong>g total energy expenditure (Ė) by velocity (v) <strong>and</strong><br />
converted to SI units, were 1 mlO 2 is equivalent to 20.1 J (Zamparo et al.,<br />
2005; Fern<strong>and</strong>es et al., 2006):<br />
C = Ė /v (1)<br />
The Ė corrected for body mass was calculated us<strong>in</strong>g the V � O 2 net (difference<br />
between the value measured <strong>in</strong> the end of the stage <strong>and</strong> the rest<br />
value), <strong>and</strong> the blood lactate net (difference between the value measured<br />
<strong>in</strong> two consecutive stages) transformed <strong>in</strong>to V � O 2 equivalents us<strong>in</strong>g a<br />
2.7mlO 2 kg -1 mmol -1 proportionality constant <strong>and</strong> by Equation (2) (cf.<br />
Fern<strong>and</strong>es et al., 2006)<br />
Ė = V� O2net + [La-]net (2)<br />
Two video cameras (JVC GR-SX1 SVHS <strong>and</strong> JVC GR-SXM 25 SVHS)<br />
were fixed on the lateral wall of the pool at a 10 m distance perpendicular<br />
to the swimmers’ plane of movement. The cameras were connected to<br />
a double entry <strong>and</strong> edited on a mix<strong>in</strong>g table (Panasonic Digital Mixer<br />
WJ-AVE55 VHS), provid<strong>in</strong>g a dual-media image (Panasonic AG 7355),<br />
below <strong>and</strong> above the water surface (Vilas-Boas et al., 2006), at a frequency<br />
of 50 Hz (1:250/s shutter speed).<br />
For each step of the <strong>in</strong>cremental protocol, two arm strokes were analysed<br />
<strong>in</strong> every 50 m of the 200 m. Arm strok<strong>in</strong>g coord<strong>in</strong>ation was obta<strong>in</strong>ed<br />
through IdC (Chollet et al., 2000), be<strong>in</strong>g each arm stroke broken down<br />
<strong>in</strong>to four phases: (i) entry <strong>and</strong> catch (correspond<strong>in</strong>g to the time between<br />
the entry of the h<strong>and</strong> <strong>in</strong>to the water <strong>and</strong> the beg<strong>in</strong>n<strong>in</strong>g of its backward<br />
movement); (ii) pull (correspond<strong>in</strong>g to the time between the beg<strong>in</strong>n<strong>in</strong>g<br />
of the h<strong>and</strong>’s backward movement <strong>and</strong> its arrival <strong>in</strong> a vertical plane to the<br />
shoulder); (iii) push (correspond<strong>in</strong>g to the time from the position of the<br />
h<strong>and</strong> below the shoulder to its release from the water) <strong>and</strong> (iv) recovery<br />
(correspond<strong>in</strong>g to the po<strong>in</strong>t of water release to water re-entry of the arm,<br />
i.e., the above water phase). The duration of each phase was measured<br />
for each arm-stroke cycle with a precision of 0.02 s. The duration of the<br />
propulsive phases was the addition of the pull <strong>and</strong> the push phases, <strong>and</strong><br />
the duration of the non-propulsive phases was obta<strong>in</strong>ed by the sum of<br />
chaPter2.<strong>Biomechanics</strong><br />
the catch <strong>and</strong> the recovery phases (the duration of a complete arm-stroke<br />
was the sum of the propulsive <strong>and</strong> non-propulsive phases). The IdC was<br />
calculated as the time gap between the propulsion of the two arms as a<br />
percentage of the duration of the complete arm stroke cycle. Higher negative<br />
percentage values expressed an evident discont<strong>in</strong>uity <strong>in</strong> the <strong>in</strong>ter-arm<br />
propulsion, tend<strong>in</strong>g to IdC=0% as the time gap was dim<strong>in</strong>ish<strong>in</strong>g.<br />
Mean ± SD computations for descriptive analysis were obta<strong>in</strong>ed <strong>in</strong><br />
each stage for all variables (all data were checked for distribution normality<br />
with the Shapiro-Wilk test). Pearson correlation coefficient <strong>and</strong> partial<br />
correlation were applied. Level of significance was established at 5%.<br />
results<br />
The mean ± SD values of velocity, % V � O 2 max, C, <strong>and</strong> IdC, obta<strong>in</strong>ed <strong>in</strong><br />
each step dur<strong>in</strong>g the <strong>in</strong>termittent <strong>in</strong>cremental test, are presented <strong>in</strong> Table<br />
1. An <strong>in</strong>crease of swimm<strong>in</strong>g <strong>in</strong>tensity implies an <strong>in</strong>crease of both C <strong>and</strong><br />
IdC (Table 1).<br />
Table 1. Mean values of velocity, % V� O2max, IdC <strong>and</strong> C obta<strong>in</strong>ed <strong>in</strong><br />
each 200 m step of the <strong>in</strong>cremental protocol (n=7).<br />
Step velocity (m·s-1 ) % V� O2max C ( J·kg-1 ·m-1 1 1.15 ± 0.1 72.1 ± 8.7<br />
)<br />
9.4 ± 2.5<br />
IdC (%)<br />
-12.5 ± 2.5<br />
2 1.20 ± 0.1 76.5 ± 9.1 10.3 ± 2.8 -12.1 ± 2.7<br />
3 1.25 ± 0.1 77.8 ± 5.3 10.1 ± 3.0 -11.8 ± 2.6<br />
4 1.30 ± 0.1 85.5 ± 3.3 11.5 ± 3.2 -10.9 ± 2.6<br />
5 1.35 ± 0.1 90.9 ± 3.2 12.7 ± 2.8 -9.7 ± 2.7<br />
6 1.40 ± 0.1 97.3 ± 3.2 13.7 ± 2.4 -8.2 ± 2.7<br />
7 1.45 ± 0.1 100.0 ± 0.0 14.0 ± 4.2 -6.8 ± 2.5<br />
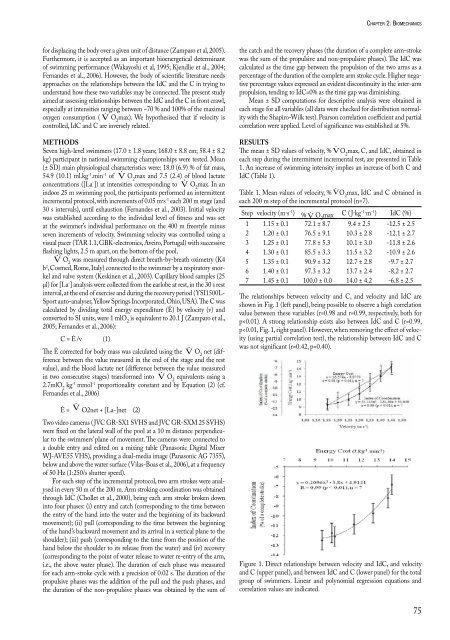
The relationships between velocity <strong>and</strong> C, <strong>and</strong> velocity <strong>and</strong> IdC are<br />
shown <strong>in</strong> Fig. 1 (left panel), be<strong>in</strong>g possible to observe a high correlation<br />
value between these variables (r=0.98 <strong>and</strong> r=0.99, respectively, both for<br />
p


