

Biomechanics and Medicine in Swimming XI
Biomechanics and Medicine in Swimming XI
Biomechanics and Medicine in Swimming XI

You also want an ePaper? Increase the reach of your titles
YUMPU automatically turns print PDFs into web optimized ePapers that Google loves.
average VO2 measured dur<strong>in</strong>g rest<strong>in</strong>g 30s before the start of<br />
g the first 20s of data after the onset of exercise. The basel<strong>in</strong>e<br />
average VO2 measured dur<strong>in</strong>g rest<strong>in</strong>g 30s before the start of<br />
⎡ ⎤ ⎡ ⎤<br />
= VO − l − l ⎥<br />
(1)<br />
<strong>Biomechanics</strong><strong>and</strong>medic<strong>in</strong>e<strong>in</strong>swimm<strong>in</strong>gXi<br />
−<br />
⎛ t−TD1<br />
⎞<br />
−<br />
⎛ t−TD2<br />
⎞<br />
⎜ ⎟<br />
⎜ ⎟<br />
⎝ τ1<br />
⎠<br />
⎝ τ 2 ⎠<br />
2b<br />
+ A1<br />
⎢1<br />
⎥ + A2<br />
⎢1<br />
⎛ t−TD<br />
⎛ −<br />
⎡ − 1 ⎞ ⎤ ⎡ −<br />
t TD2<br />
⎞<br />
⎜ ⎟<br />
⎜ ⎟ ⎤<br />
+ ⎣ ⎝ τ1<br />
⎠ − + ⎦ −⎣<br />
⎝ τ 2 ⎠<br />
2b<br />
A1<br />
1 A2<br />
1<br />
) = VO ⎢ l ⎥ ⎢ l ⎥ ⎦ (1)<br />
The physiologically ⎣<br />
relevant ⎦ <strong>in</strong>crease ⎣ <strong>in</strong> VO2 is the ⎦ amplitude of phase I<br />
(A1’), or primary component, which was calculated from:<br />
h relevant was calculated <strong>in</strong>crease <strong>in</strong> from: VO2 is the amplitude of phase I (A1’), or<br />
ch was calculated<br />
⎛<br />
from: ( )<br />
⎜<br />
⎛ −<br />
TD2−TD1<br />
⎟<br />
⎞<br />
'<br />
⎞<br />
⎝<br />
τ 1⎠<br />
(2)<br />
= ⎜ −<br />
⎟<br />
1 A⎛1<br />
1 ( )<br />
⎜<br />
⎛ −<br />
TD2−TD1<br />
⎟<br />
⎞<br />
'<br />
⎞<br />
⎝<br />
τ 1⎠<br />
A ⎜<br />
⎜⎝<br />
⎟<br />
1 = A1<br />
1−<br />
l ⎠<br />
(2)<br />
⎝<br />
⎠<br />
Because the asymptotic value (A2) may represent a higher value than<br />
otic value<br />
that<br />
(A2)<br />
actually<br />
may<br />
reached<br />
represent<br />
at the end<br />
a higher<br />
of the exercise,<br />
value than<br />
the value<br />
that<br />
of<br />
actually<br />
the VO2<br />
exercise, slow the exponential value of term the at VO2 the end slow of exercise exponential was def<strong>in</strong>ed term as at (A2’): the end<br />
s (A2’):<br />
⎛ ( )<br />
⎜<br />
⎛ −<br />
ED−TD2<br />
⎟<br />
⎞<br />
' ⎛ ( )<br />
⎜<br />
⎛ −<br />
ED−TD2<br />
⎟<br />
⎞ ⎞ (3)<br />
'<br />
⎝ ⎞ τ 2 ⎠<br />
= ⎜ ⎝<br />
τ 2 ⎠<br />
A −<br />
⎟<br />
2 = A2<br />
⎜ 1−<br />
⎟<br />
2 A2<br />
1 l (3)<br />
⎝⎝<br />
⎠ ⎠<br />
duration. where ED is the exercise duration.<br />
relevant <strong>in</strong>crease <strong>in</strong> VO2 is the amplitude of phase I (A1’), or<br />
A l (2)<br />
tic value (A2) may represent a higher value than that actually<br />
exercise, the value of the VO2 slow exponential term at the end<br />
duration.<br />
A l (3)<br />
Statistical analysis: The values were expressed as mean ± SD. The normal-<br />
values were expressed as mean ± SD. The normality of data<br />
values were expressed as mean ± SD. The normality of data<br />
-Wilk test.<br />
ity of<br />
The<br />
data was<br />
statistical<br />
checked by<br />
difference<br />
Shapiro-Wilk<br />
between<br />
test. The<br />
two<br />
statistical<br />
means<br />
difference<br />
was<br />
-Wilk test. between The two statistical means was checked difference by a paired between Student’s t-test two (2-tailed). means was<br />
dent’s t-test (2-tailed). Bi-exponential analyses were performed<br />
ent’s t-test Bi-exponential<br />
duals method. (2-tailed). analyses<br />
The level of Bi-exponential were performed by<br />
significance was analyses the least squared<br />
set at p were residuals<br />
≤ 0.05. performed<br />
method. The level of significance was set at p ≤ 0.05. All statistical analy- All<br />
performed uals method. by utiliz<strong>in</strong>g The level software of significance SPSS 17.0. was set at p ≤ 0.05. All<br />
ses were performed by utiliz<strong>in</strong>g software SPSS 17.0.<br />
erformed by utiliz<strong>in</strong>g software SPSS 17.0.<br />
RESULTS<br />
Variables presented <strong>in</strong> Table 1 describe the physiological <strong>and</strong> perfor-<br />
able 1 describe the physiological <strong>and</strong> performance parameters<br />
delimit<strong>in</strong>g exercise doma<strong>in</strong>s. The RCP was observed to<br />
po<strong>in</strong>t between VT <strong>and</strong> VO2max, but substantial variability was<br />
ble 1.<br />
cremental test. n = 9.<br />
to BW Relative to Velocity<br />
1<br />
) VO2max (%) (m·s -1 able 1 describe the physiological <strong>and</strong> performance parameters<br />
delimit<strong>in</strong>g exercise doma<strong>in</strong>s. The RCP was observed to<br />
po<strong>in</strong>t between VT <strong>and</strong> VO2max, but substantial variability was<br />
able 1.<br />
ncremental test. n = 9.<br />
to BW Relative to Velocity<br />
-1<br />
) VO2max (%) (m·s<br />
Delta<br />
) (%∆)<br />
100 1.40 (±0.03) 100<br />
70.5 (±8.0) 1.21 (±0.06) 0<br />
-1 mance parameters related to the <strong>in</strong>dices delimit<strong>in</strong>g exercise doma<strong>in</strong>s.<br />
The RCP was observed to correspond with the midpo<strong>in</strong>t between VT<br />
<strong>and</strong> VO2max , but substantial variability was observed, as shown on Table<br />
1.<br />
Table 1: Parameters for <strong>in</strong>cremental test. n = 9.<br />
VO Delta<br />
2 relative to BW<br />
(ml ) (%∆)<br />
100 1.40 (±0.03) 100<br />
70.5 (±8.0) 1.21 (±0.06) 0<br />
86.0 (±4.9) 1.32 (±0.05) 51.0 (±16.5)<br />
. m<strong>in</strong>-1 .kg-1 Relative to Velocity<br />
) VO2max (%) (m·s-1 Delta<br />
) (%Δ)<br />
VO2max 58.0 (±5.1) 100 1.40 (±0.03) 100<br />
VT 41.1 (±7.3) 70.5 (±8.0) 1.21 (±0.06) 0<br />
RCP 49.9 (±5.5) 86.0 (±4.9) 1.32 (±0.05) 51.0 (±16.5)<br />
The trivial difference between predeterm<strong>in</strong>ed <strong>and</strong> performed trials above<br />
(1.35 ± 0.05 m·s<br />
86.0 (±4.9) 1.32 (±0.05) 51.0 (±16.5)<br />
-1 <strong>and</strong> 1.34 ± 0.05 m·s-1 , ρ = 0.54) <strong>and</strong> below (1.28 ± 0.05<br />
m·s-1 <strong>and</strong> 1.28 ± 0.05 m·s-1 , ρ = 0.78) RCP ensured the effective control<br />
of the velocity under the test condition. The velocity measured dur<strong>in</strong>g<br />
trials was closer to the def<strong>in</strong>ed velocity <strong>in</strong> both trials above (2.0 ± 1.2%)<br />
<strong>and</strong> below (-2.7 ± 0.8%) the RCP.<br />
Table 2: Parameters of VO2 on-k<strong>in</strong>etics around RCP. n = 9.<br />
2.5% below RCP 2.5% above RCP<br />
VO2Basel<strong>in</strong>e (ml.m<strong>in</strong>-1 ) 474.90 ± 91.24 523.78 ± 79.08<br />
TD1 (s) 17.6 ± 3.3 14.0 ± 5.6 †<br />
t1 (s) 17.8 ± 7.1 16.1 ± 4.9<br />
A’ 1 (ml·m<strong>in</strong>-1 ) 2.784.93 ± 616.02 3.247.04 ± 669.99 †<br />
R2 0.97 ± 0.02 0.93 ± 0.04<br />
TD2 (s) 153.8 ± 42.5 188.4 ± 97.2<br />
t2 (s) 99.5 ± 82.2 73.8 ± 67.4<br />
A’ 2 (ml·m<strong>in</strong>-1 ) 391.24 ± 236.61 399.40 ± 270.49<br />
R2 0.69 ± 0.26 0.66 ± 0.23<br />
EEVO2 (ml·m<strong>in</strong>-1 ) 3.176.17 ± 647.01 3.646.45 ± 823.11 †<br />
A’ 2 %EEVO2 12.4 ± 7.3 10.5 ± 5.3<br />
TotalVO2 (ml·m<strong>in</strong>-1 ) 3.651.07 ± 660.36 4.170.23 ± 810.11 †<br />
%VO2max atta<strong>in</strong>ed 92.0 ± 6.0 105.0 ± 9.5 †<br />
EEVO 2 is the <strong>in</strong>crease <strong>in</strong> VO 2 above basel<strong>in</strong>e at end of exercise. † Marked<br />
differences (p < 0.05) were observed <strong>in</strong> relation to 2.5% below RCP.<br />
216<br />
Time parameters of VO2 on-k<strong>in</strong>etics seems not to differ substantially<br />
between trials around RCP, with the exception of TD1 (p = 0.03) (Table<br />
2). This scenario suggests that the response for the primary component<br />
beg<strong>in</strong>s early while swimm<strong>in</strong>g above rather than below RCP. The amplitude<br />
parameters account for the noticeable differences between trials<br />
<strong>in</strong> each condition. Primary amplitude, end-exercise VO2 (EEVO2 ), <strong>and</strong><br />
entire VO2 (TotalVO2 ) showed difference for their paired values <strong>in</strong> each<br />
trial (p values of 0.001, 0.001, <strong>and</strong> 0.000, respectively) (Table 2). There<br />
was no tendency for the onset of the slow component (TDs) to occur<br />
earlier as exercis<strong>in</strong>g above (188.4s) <strong>and</strong> below (153.8s) RCP <strong>in</strong>tensity,<br />
neither to differ <strong>in</strong> amplitude (399.4 <strong>and</strong> 391.2 ml.m<strong>in</strong>-1 above <strong>and</strong> below<br />
RCP, respectively), or <strong>in</strong> relative contribution to the EEVO2 (10.5<br />
<strong>and</strong> 12.4% above <strong>and</strong> below RCP, respectively) (Table 2). None of the<br />
subjects reached the exhaustion <strong>in</strong> either trial (above <strong>and</strong> below RCP),<br />
however because of the slow component, TotalVO2 elicit<strong>in</strong>g 104.57 <strong>and</strong><br />
91.58% of VO2max while swimm<strong>in</strong>g above <strong>and</strong> below RCP, respectively.<br />
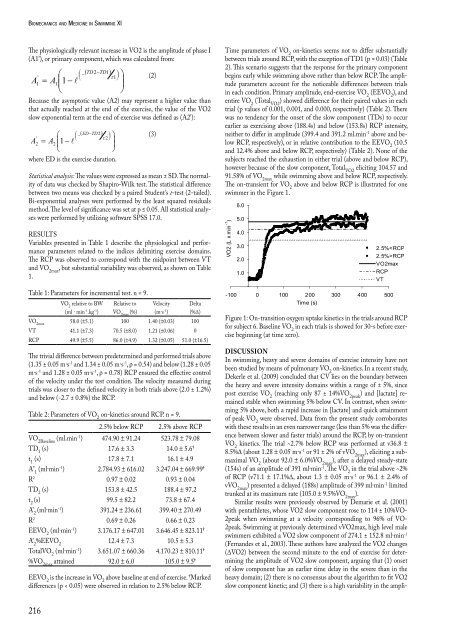
The on-transient for VO2 above <strong>and</strong> below RCP is illustrated for one<br />
swimmer <strong>in</strong> the Figure 1.<br />
VO2 (L x m<strong>in</strong> -1 )<br />
6.0<br />
5.0<br />
4.0<br />
3.0<br />
2.0<br />
1.0<br />
2.5%RCP<br />
VO2max<br />
RCP<br />
VT<br />
-100 0 100 200 300 400 500<br />
Time (s)<br />
Figure 1: On-transition oxygen uptake k<strong>in</strong>etics <strong>in</strong> the trials around RCP<br />
for subject 6. Basel<strong>in</strong>e VO 2 <strong>in</strong> each trials is showed for 30-s before exercise<br />
beg<strong>in</strong>n<strong>in</strong>g (at time zero).<br />
dIscussIon<br />
In swimm<strong>in</strong>g, heavy <strong>and</strong> severe doma<strong>in</strong>s of exercise <strong>in</strong>tensity have not<br />
been studied by means of pulmonary VO 2 on-k<strong>in</strong>etics. In a recent study,<br />
Dekerle et al. (2009) concluded that CV lies on the boundary between<br />
the heavy <strong>and</strong> severe <strong>in</strong>tensity doma<strong>in</strong>s with<strong>in</strong> a range of ± 5%, s<strong>in</strong>ce<br />
post exercise VO 2 (reach<strong>in</strong>g only 87 ± 14%VO 2peak ) <strong>and</strong> [lactate] rema<strong>in</strong>ed<br />
stable when swimm<strong>in</strong>g 5% below CV. In contrast, when swimm<strong>in</strong>g<br />
5% above, both a rapid <strong>in</strong>crease <strong>in</strong> [lactate] <strong>and</strong> quick atta<strong>in</strong>ment<br />
of peak VO 2 were observed. Data from the present study corroborates<br />
with these results <strong>in</strong> an even narrower range (less than 5% was the difference<br />
between slower <strong>and</strong> faster trials) around the RCP, by on-transient<br />
VO 2 k<strong>in</strong>etics. The trial ~2.7% below RCP was performed at v36.8 ±<br />
8.5%∆ (about 1.28 ± 0.05 m·s -1 or 91 ± 2% of vVO 2max ), elicit<strong>in</strong>g a submaximal<br />
VO 2 (about 92.0 ± 6.0%VO 2max ), after a delayed steady-state<br />
(154s) of an amplitude of 391 ml·m<strong>in</strong> -1 . The VO 2 <strong>in</strong> the trial above ~2%<br />
of RCP (v71.1 ± 17.1%Δ, about 1.3 ± 0.05 m·s -1 or 96.1 ± 2.4% of<br />
vVO 2max ) presented a delayed (188s) amplitude of 399 ml·m<strong>in</strong> -1 limited<br />
trunked at its maximum rate (105.0 ± 9.5%VO 2max ).<br />
Similar results were previously observed by Demarie et al. (2001)<br />
with pentathletes, whose VO2 slow component rose to 114 ± 10%VO-<br />
2peak when swimm<strong>in</strong>g at a velocity correspond<strong>in</strong>g to 96% of VO-<br />
2peak. Swimm<strong>in</strong>g at previously determ<strong>in</strong>ed vVO2max, high level male<br />
swimmers exhibited a VO2 slow component of 274.1 ± 152.8 ml·m<strong>in</strong> -1<br />
(Fern<strong>and</strong>es et al., 2003). These authors have analyzed the VO2 changes<br />
(ΔVO2) between the second m<strong>in</strong>ute to the end of exercise for determ<strong>in</strong><strong>in</strong>g<br />
the amplitude of VO2 slow component, argu<strong>in</strong>g that (1) onset<br />
of slow component has an earlier time delay <strong>in</strong> the severe than <strong>in</strong> the<br />
heavy doma<strong>in</strong>; (2) there is no consensus about the algorithm to fit VO2<br />
slow component k<strong>in</strong>etic; <strong>and</strong> (3) there is a high variability <strong>in</strong> the ampli-


