

Biomechanics and Medicine in Swimming XI
Biomechanics and Medicine in Swimming XI
Biomechanics and Medicine in Swimming XI

Create successful ePaper yourself
Turn your PDF publications into a flip-book with our unique Google optimized e-Paper software.
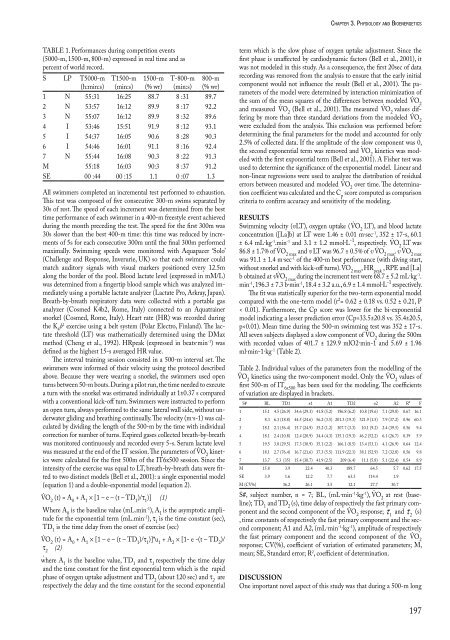
TABLE 1. Performances dur<strong>in</strong>g competition events<br />
(5000-m, 1500-m, 800-m) expressed <strong>in</strong> real time <strong>and</strong> as<br />
percent of world record.<br />
S LP T5000-m<br />
(h:m<strong>in</strong>:s)<br />
T1500-m<br />
(m<strong>in</strong>:s)<br />
1500-m<br />
(% wr)<br />
T-800-m<br />
(m<strong>in</strong>:s)<br />
800-m<br />
(% wr)<br />
1 N 55:31 16:25 88.7 8 :31 89.7<br />
2 N 53:57 16:12 89.9 8 :17 92.2<br />
3 N 55:07 16:12 89.9 8 :32 89.6<br />
4 I 53:46 15:51 91.9 8 :12 93.1<br />
5 I 54:37 16:05 90.6 8 :28 90.3<br />
6 I 54:46 16:01 91.1 8 :16 92.4<br />
7 N 55:44 16:08 90.3 8 :22 91.3<br />
M 55:18 16:03 90:3 8 :37 91.2<br />
SE 00 :44 00 :15 1.1 0 :07 1.3<br />
All swimmers completed an <strong>in</strong>cremental test performed to exhaustion.<br />
This test was composed of five consecutive 300-m swims separated by<br />
30s of rest. The speed of each <strong>in</strong>crement was determ<strong>in</strong>ed from the best<br />
time performance of each swimmer <strong>in</strong> a 400-m freestyle event achieved<br />
dur<strong>in</strong>g the month preced<strong>in</strong>g the test. The speed for the first 300m was<br />
30s slower than the best 400-m time: this time was reduced by <strong>in</strong>crements<br />
of 5s for each consecutive 300m until the f<strong>in</strong>al 300m performed<br />
maximally. Swimm<strong>in</strong>g speeds were monitored with Aquapacer ‘Solo’<br />
(Challenge <strong>and</strong> Response, Inverurie, UK) so that each swimmer could<br />
match auditory signals with visual markers positioned every 12.5m<br />
along the border of the pool. Blood lactate level (expressed <strong>in</strong> mM/L)<br />
was determ<strong>in</strong>ed from a f<strong>in</strong>gertip blood sample which was analyzed immediately<br />
us<strong>in</strong>g a portable lactate analyzer (Lactate Pro, Arkray, Japan).<br />
Breath-by-breath respiratory data were collected with a portable gas<br />
analyzer (Cosmed K4b2, Rome, Italy) connected to an Aquatra<strong>in</strong>er<br />
snorkel (Cosmed, Rome, Italy). Heart rate (HR) was recorded dur<strong>in</strong>g<br />
the K 4 b 2 exercise us<strong>in</strong>g a belt system (Polar Electro, F<strong>in</strong>l<strong>and</strong>). The lactate<br />
threshold (LT) was mathematically determ<strong>in</strong>ed us<strong>in</strong>g the DMax<br />
method (Cheng et al., 1992). HRpeak (expressed <strong>in</strong> beats·m<strong>in</strong> -1 ) was<br />
def<strong>in</strong>ed as the highest 15-s averaged HR value.<br />
The <strong>in</strong>terval tra<strong>in</strong><strong>in</strong>g session consisted <strong>in</strong> a 500-m <strong>in</strong>terval set. The<br />
swimmers were <strong>in</strong>formed of their velocity us<strong>in</strong>g the protocol described<br />
above. Because they were wear<strong>in</strong>g a snorkel, the swimmers used open<br />
turns between 50-m bouts. Dur<strong>in</strong>g a pilot run, the time needed to execute<br />
a turn with the snorkel was estimated <strong>in</strong>dividually at 1±0.37 s compared<br />
with a conventional kick-off turn. Swimmers were <strong>in</strong>structed to perform<br />
an open turn, always performed to the same lateral wall side, without underwater<br />
glid<strong>in</strong>g <strong>and</strong> breath<strong>in</strong>g cont<strong>in</strong>ually. The velocity (m·s-1) was calculated<br />
by divid<strong>in</strong>g the length of the 500-m by the time with <strong>in</strong>dividual<br />
correction for number of turns. Expired gases collected breath-by-breath<br />
was monitored cont<strong>in</strong>uously <strong>and</strong> recorded every 5-s. Serum lactate level<br />
was measured at the end of the IT session. The parameters of · VO 2 k<strong>in</strong>etics<br />
were calculated for the first 500m of the IT6x500 session. S<strong>in</strong>ce the<br />
<strong>in</strong>tensity of the exercise was equal to LT, breath-by-breath data were fitted<br />
to two dist<strong>in</strong>ct models (Bell et al., 2001): a s<strong>in</strong>gle exponential model<br />
(equation 1) <strong>and</strong> a double-exponential model (equation 2).<br />
·<br />
VO 2 (t) = A 0 + A 1 × [1 – e – (t – TD 1 )/τ 1 )] (1)<br />
Where A 0 is the basel<strong>in</strong>e value (mL.m<strong>in</strong> -1 ), A 1 is the asymptotic amplitude<br />
for the exponential term (mL.m<strong>in</strong> -1 ), τ 1 is the time constant (sec),<br />
TD 1 is the time delay from the onset of exercise (sec)<br />
·<br />
VO 2 (t) = A 0 + A 1 × [1 – e – (t – TD 1 )/τ 1 )]*u 1 + A 2 × [1- e -(t – TD 2 )/<br />
τ 2 (2)<br />
·<br />
where A 1 is the basel<strong>in</strong>e value, TD 1 <strong>and</strong> τ 1 respectively the time delay<br />
<strong>and</strong> the time constant for the first exponential term which is the rapid<br />
phase of oxygen uptake adjustment <strong>and</strong> TD 2 (about 120 sec) <strong>and</strong> τ 2 are<br />
respectively the delay <strong>and</strong> the time constant for the second exponential<br />
chaPter3.PhysioLogy<strong>and</strong>Bioenergetics<br />
term which is the slow phase of oxygen uptake adjustment. S<strong>in</strong>ce the<br />
first phase is unaffected by cardiodynamic factors (Bell et al., 2001), it<br />
was not modeled <strong>in</strong> this study. As a consequence, the first 20sec of data<br />
record<strong>in</strong>g was removed from the analysis to ensure that the early <strong>in</strong>itial<br />
component would not <strong>in</strong>fluence the result (Bell et al., 2001). The parameters<br />
of the model were determ<strong>in</strong>ed by <strong>in</strong>teraction m<strong>in</strong>imization of<br />
the sum of the mean squares of the differences between modeled VO<br />
·<br />
2<br />
<strong>and</strong> measured · VO2 (Bell et al., 2001). The measured · VO2 values differ<strong>in</strong>g<br />
by more than three st<strong>and</strong>ard deviations from the modeled · VO2 were excluded from the analysis. This exclusion was performed before<br />
determ<strong>in</strong><strong>in</strong>g the f<strong>in</strong>al parameters for the model <strong>and</strong> accounted for only<br />
2.5% of collected data. If the amplitude of the slow component was 0,<br />
the second exponential term was removed <strong>and</strong> ·<br />
VO2 k<strong>in</strong>etics was modeled<br />
with the first exponential term (Bell et al., 2001). A Fisher test was<br />
used to determ<strong>in</strong>e the significance of the exponential model. L<strong>in</strong>ear <strong>and</strong><br />
non-l<strong>in</strong>ear regressions were used to analyze the distribution of residual<br />
errors between measured <strong>and</strong> modeled · VO2 over time. The determ<strong>in</strong>ation<br />
coefficient was calculated <strong>and</strong> the Cp score computed as comparison<br />
criteria to confirm accuracy <strong>and</strong> sensitivity of the model<strong>in</strong>g.<br />
results<br />
Swimm<strong>in</strong>g velocity (vLT), oxygen uptake ( · VO 2 LT), <strong>and</strong> blood lactate<br />
concentration ([La]b) at LT were 1.46 ± 0.01 m·sec -1 , 352 ± 17-s, 60.1<br />
± 6.4 mL·kg -1 .m<strong>in</strong> -1 <strong>and</strong> 3.1 ± 1.2 mmol·L -1 , respectively. · VO 2 LT was<br />
86.8 ± 1.7% of · VO 2 max <strong>and</strong> v LT was 96.7 ± 0.5% of v · VO 2 max . v · VO 2 max<br />
was 91.1 ± 1.4 m·sec -1 of the 400-m best performance (with div<strong>in</strong>g start,<br />
without snorkel <strong>and</strong> with kick-off turns). · VO 2 max , HR peak , RPE <strong>and</strong> [La]<br />
b obta<strong>in</strong>ed at v · VO 2 max dur<strong>in</strong>g the <strong>in</strong>crement test were 68.7 ± 5.2 mL·kg -1 .<br />
m<strong>in</strong> -1 , 196.3 ± 7.3 b·m<strong>in</strong> -1 , 18.4 ± 3.2 a.u., 6.9 ± 1.4 mmol·L -1 respectively.<br />
The fit was statistically superior for the two-term exponential model<br />
compared with the one-term model (r²= 0.62 ± 0.18 vs. 0.52 ± 0.21, P<br />
< 0.01). Furthermore, the Cp score was lower for the bi-exponential<br />
model <strong>in</strong>dicat<strong>in</strong>g a lesser prediction error (Cp=33.5±20.8 vs. 35.4±20.5,<br />
p


