Biomechanics and Medicine in Swimming XI
Biomechanics and Medicine in Swimming XI
Biomechanics and Medicine in Swimming XI
Create successful ePaper yourself
Turn your PDF publications into a flip-book with our unique Google optimized e-Paper software.
<strong>Biomechanics</strong><strong>and</strong>medic<strong>in</strong>e<strong>in</strong>swimm<strong>in</strong>gXi<br />
5cm; Arm Span: 182 ± 5cm; Competitive experience: 5 ± 1 years old)<br />
participated <strong>in</strong> the study. All swimmers tra<strong>in</strong>ed while perform<strong>in</strong>g the<br />
test<strong>in</strong>g (high volume; low to moderate <strong>in</strong>tensity level). They swam six<br />
to eight tra<strong>in</strong><strong>in</strong>g sessions per week (six to eight km per session). Prior<br />
to the commencement of the test<strong>in</strong>g, the person <strong>in</strong> charge of the swimmers<br />
signed <strong>in</strong>formed consents, the study be<strong>in</strong>g approved for the Ethics<br />
Committee of the University.<br />
Protocol: Maximal swimm<strong>in</strong>g trials (front crawl) were over 6 distances<br />
(50, 100, 200, 400, 800 <strong>and</strong> 1500-m) with<strong>in</strong> 16 days with a m<strong>in</strong>imum<br />
of 48 hours between each trial. The order of the trials was r<strong>and</strong>omized.<br />
A 50-m pool of controlled temperature (28 ± 0.5 ºC) was used. All trials<br />
were conducted at the same time of the day (8:00 am) with a prior<br />
warm up performed <strong>in</strong> free style at moderate <strong>in</strong>tensity for 2000-m. Each<br />
swimmer was <strong>in</strong>structed to perform as best as they could dur<strong>in</strong>g each<br />
trial. Performance times were measured by three experienced coaches<br />
who used a manual chronometer.<br />
Data analysis: The average performance time collected from each<br />
of the three measures were manually typed <strong>in</strong>to a spreadsheet for the<br />
estimative of the various CSS. CSS was computed for the follow<strong>in</strong>g<br />
comb<strong>in</strong>ations of distances: CSS 1 (50-100m), CSS 2 (50-200m), CSS 3<br />
(50-400m), CSS 4 (50-800m), CSS 5 (50-1500m), CSS 6 (100-200m),<br />
CSS 7 (100-400m), CSS 8 (100-800m), CSS 9 (100-1500m), CSS 10 (200-<br />
400m), CSS 11 (200-800m), CSS 12 (200-1500m), CSS 13 (400-800m),<br />
CSS 14 (400-1500m) <strong>and</strong> CSS 15 (800-1500m).<br />
Statistical analysis: To address the first aim of the study, different<br />
comb<strong>in</strong>ations for predict<strong>in</strong>g CSS were compared. Mean <strong>and</strong> st<strong>and</strong>ard<br />
deviation were selected to present the data after normality <strong>and</strong> sphericity<br />
analysis by the Shapiro Wilk <strong>and</strong> Mauchly tests, respectively. The<br />
t-test for pared sample was used for the comparison between CSS 10 vs<br />
all others 14 CSS comb<strong>in</strong>ations <strong>and</strong> between CSS 10 vs V 1500 . Significant<br />
results were selected when Type I error was rejected for a threshold<br />
level of 5%. SPSS software was employed for the aforementioned tests.<br />
The levels of agreement between the several predictions of CSS were<br />
analyzed us<strong>in</strong>g Bl<strong>and</strong> <strong>and</strong> Altman analysis (Bl<strong>and</strong> <strong>and</strong> Altman, 1986).<br />
The results were presented based on the differences between each CSS<br />
predictions (i.e. CSS 10 vs the all others 14 CSS comb<strong>in</strong>ations) <strong>and</strong> between<br />
CSS 10 <strong>and</strong> V 1500 .<br />
results<br />
Mean <strong>and</strong> st<strong>and</strong>ard deviation of performance time (s) <strong>in</strong> each distance<br />
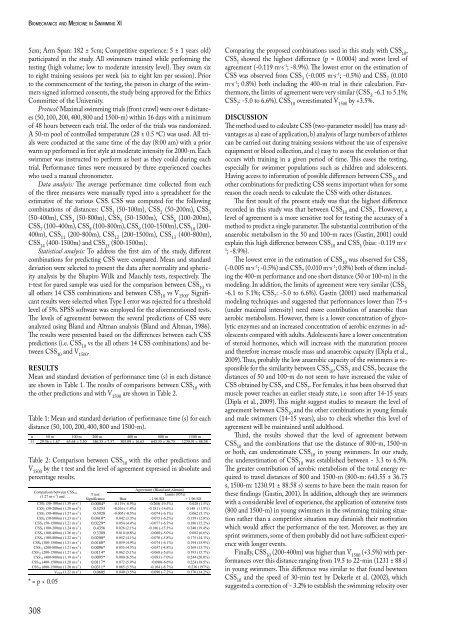
are shown <strong>in</strong> Table 1. The results of comparisons between CSS 10 with<br />
the other predictions <strong>and</strong> with V 1500 are shown <strong>in</strong> Table 2.<br />
<strong>Biomechanics</strong> <strong>and</strong> <strong>Medic<strong>in</strong>e</strong> <strong>in</strong> Swimm<strong>in</strong>g <strong>XI</strong> / Chapter 4 Tra<strong>in</strong><strong>in</strong>g Page 168<br />
Table 1: Mean <strong>and</strong> st<strong>and</strong>ard deviation of performance time (s) for each<br />
distance (50, 100, 200, 400, 800 <strong>and</strong> 1500-m).<br />
Table 1: Mean <strong>and</strong> st<strong>and</strong>ard deviation of performance time (s) for each distance (50,<br />
100, <strong>Biomechanics</strong> 200, 400, 800 <strong>and</strong> <strong>and</strong> <strong>Medic<strong>in</strong>e</strong> 1500-m). <strong>in</strong> Swimm<strong>in</strong>g <strong>XI</strong> / Chapter 4 Tra<strong>in</strong><strong>in</strong>g Page 168<br />
n 50 m 100 m 200 m 400 m 800 m 1500 m<br />
11 29.36 ± 1.67 65.64 ± 3.50 146.55 ± 7.57 305.09 ± 16.65 643.55 ± 36.75 1230.91 ± 88.58<br />
Table 2: Comparison between CSS10 with the other predictions <strong>and</strong> V1500 by the t test<br />
<strong>and</strong> the level of agreement expressed <strong>in</strong> absolute <strong>and</strong> percentage results.<br />
Comparison between CSS10<br />
(1.27 m·s<br />
308<br />
-1 Agreement (Bl<strong>and</strong> <strong>and</strong> Altman)<br />
T test<br />
Limits (95%)<br />
) <strong>and</strong> . . .<br />
Significance Bias<br />
- 1.96 SD + 1.96 SD<br />
CSS1 (50-100m) (1.39 m·s -1 ) 0.0004* -0.119 (-8.9%) -0.268(-19.3%) 0.028 (1.5%)<br />
-1<br />
CSS2 (50-200m) (1.28 m·s ) 0.5253 -0.016 (-1.4%) -0.181 (-14.6%) 0.148 (11.9%)<br />
CSS3 (50-400m) (1.27 m·s -1 ) 0.5928 -0.005 (-0.5%) -0.074 (-6.1%) 0.062 (5.1%)<br />
-1<br />
CSS4 (50-800m) (1.23 m·s ) 0.0410* 0.042 (3.3%) -0.075 (-6.2%) 0.159 (12.8%)<br />
-1<br />
CSS5 (50-1500m) (1.21 m·s ) 0.0229* 0.054 (4.4%) -0.077 (-6.3%) 0.186 (15.2%)<br />
CSS6 (100-200m) (1.24 m·s -1 ) 0.4356 0.026 (2.1%) -0.186 (-15.3%) 0.240 (19.4%)<br />
-1<br />
CSS7 (100-400m) (1.26 m·s ) 0.3389 0.010 (0.8%) -0.060 (-5.0%) 0.082 (6.6%)<br />
-1<br />
CSS8 (100-800m) (1.22 m·s ) 0.0200* 0.052 (4.1%) -0.070 (-5.8%) 0.175 (14.1%)<br />
CSS9 (100-1500m) (1.21 m·s -1 ) 0.0160* 0.059 (4.9%) -0.074 (-6.1%) 0.194 (15.9%)<br />
-1<br />
CSS11 (200-800m) (1.21 m·s ) 0.0096* 0.055 (4.5%) -0.057 (-4.8%) 0.169 (13.7%)<br />
-1<br />
CSS12 (200-1500m) (1.21 m·s ) 0.0114* 0.062 (5.1%) -0.068 (-5.6%) 0.193 (15.7%)<br />
CSS13 (400-800m) (1.19 m·s -1 ) 0.0095* 0.080 (6.5%) -0.083 (-7.0%) 0.244 (20.0%)<br />
-1<br />
CSS14 (400-1500m) (1.20 m·s ) 0.0117* 0.072 (5.9%) -0.080(-6.6%) 0.224 (18.5%)<br />
-1<br />
CSS15 (800-1500m) (1.20 m·s ) 0.0311* 0.065 (5.5%) -0.104 (-8.7%) 0.236 (197%)<br />
V1500 (1.22 m·s -1 ) 0.0605 0.040 (3.5%) -0.090 (-7.2%) 0.170 (14.2%)<br />
* = p < 0.05<br />
Compar<strong>in</strong>g the proposed comb<strong>in</strong>ations used <strong>in</strong> this study with CSS10, CSS1 showed the<br />
highest difference (p = 0.0004) <strong>and</strong> worst level of agreement (-0.119 m·s -1 ; -8.9%). The<br />
lowest error on the estimation of CSS was observed from CSS3 (-0.005 m·s -1 ; -0.5%)<br />
<strong>and</strong> CSS7 (0.010 m·s -1 Table 1: Mean <strong>and</strong> st<strong>and</strong>ard deviation of performance time (s) for each distance (50,<br />
100, 200, 400, 800 <strong>and</strong> 1500-m).<br />
Table n 2: 50 Comparison m 100 m between 200 m CSS10 400 with m the other 800 m predictions 1500 m <strong>and</strong><br />
11 29.36 ± 1.67 65.64 ± 3.50 146.55 ± 7.57 305.09 ± 16.65 643.55 ± 36.75 1230.91 ± 88.58<br />
V1500 by the t test <strong>and</strong> the level of agreement expressed <strong>in</strong> absolute <strong>and</strong><br />
percentage Table 2: Comparison results. between CSS10 with the other predictions <strong>and</strong> V1500 by the t test<br />
<strong>and</strong> the level of agreement expressed <strong>in</strong> absolute <strong>and</strong> percentage results.<br />
Comparison between CSS10 (1.27 m·s<br />
; 0.8%) both <strong>in</strong>clud<strong>in</strong>g the 400-m trial <strong>in</strong> their calculation.<br />
Furthermore, the limits of agreement were very similar (CSS3: -6.1 to 5.1%; CSS7: -5.0<br />
to 6.6%). CSS10 overestimated V1500 by +3.5%.<br />
DISCUSSION<br />
The method used to calculate CSS (two-parameter model) has many advantages as a)<br />
ease of application, b) analysis of large numbers of athletes can be carried out dur<strong>in</strong>g<br />
tra<strong>in</strong><strong>in</strong>g sessions without the use of expensive equipment or blood collection, <strong>and</strong> c)<br />
easy to assess the evolution or that occurs with tra<strong>in</strong><strong>in</strong>g <strong>in</strong> a given period of time. This<br />
-1 Agreement (Bl<strong>and</strong> <strong>and</strong> Altman)<br />
T test<br />
Limits (95%)<br />
) <strong>and</strong> . . .<br />
Significance Bias<br />
- 1.96 SD + 1.96 SD<br />
CSS1 (50-100m) (1.39 m·s -1 ) 0.0004* -0.119 (-8.9%) -0.268(-19.3%) 0.028 (1.5%)<br />
-1<br />
CSS2 (50-200m) (1.28 m·s ) 0.5253 -0.016 (-1.4%) -0.181 (-14.6%) 0.148 (11.9%)<br />
CSS3 (50-400m) (1.27 m·s -1 ) 0.5928 -0.005 (-0.5%) -0.074 (-6.1%) 0.062 (5.1%)<br />
-1<br />
CSS4 (50-800m) (1.23 m·s ) 0.0410* 0.042 (3.3%) -0.075 (-6.2%) 0.159 (12.8%)<br />
-1<br />
CSS5 (50-1500m) (1.21 m·s ) 0.0229* 0.054 (4.4%) -0.077 (-6.3%) 0.186 (15.2%)<br />
CSS6 (100-200m) (1.24 m·s -1 ) 0.4356 0.026 (2.1%) -0.186 (-15.3%) 0.240 (19.4%)<br />
-1<br />
CSS7 (100-400m) (1.26 m·s ) 0.3389 0.010 (0.8%) -0.060 (-5.0%) 0.082 (6.6%)<br />
-1<br />
CSS8 (100-800m) (1.22 m·s ) 0.0200* 0.052 (4.1%) -0.070 (-5.8%) 0.175 (14.1%)<br />
CSS9 (100-1500m) (1.21 m·s -1 ) 0.0160* 0.059 (4.9%) -0.074 (-6.1%) 0.194 (15.9%)<br />
-1<br />
CSS11 (200-800m) (1.21 m·s ) 0.0096* 0.055 (4.5%) -0.057 (-4.8%) 0.169 (13.7%)<br />
-1<br />
CSS12 (200-1500m) (1.21 m·s ) 0.0114* 0.062 (5.1%) -0.068 (-5.6%) 0.193 (15.7%)<br />
CSS13 (400-800m) (1.19 m·s -1 ) 0.0095* 0.080 (6.5%) -0.083 (-7.0%) 0.244 (20.0%)<br />
-1<br />
CSS14 (400-1500m) (1.20 m·s ) 0.0117* 0.072 (5.9%) -0.080(-6.6%) 0.224 (18.5%)<br />
-1<br />
CSS15 (800-1500m) (1.20 m·s ) 0.0311* 0.065 (5.5%) -0.104 (-8.7%) 0.236 (197%)<br />
V1500 (1.22 m·s -1 ) 0.0605 0.040 (3.5%) -0.090 (-7.2%) 0.170 (14.2%)<br />
* = p < 0.05<br />
Compar<strong>in</strong>g the proposed comb<strong>in</strong>ations used <strong>in</strong> this study with CSS10, CSS1 showed the<br />
highest difference (p = 0.0004) <strong>and</strong> worst level of agreement (-0.119 m·s -1 ; -8.9%). The<br />
lowest error on the estimation of CSS was observed from CSS3 (-0.005 m·s -1 ; -0.5%)<br />
<strong>and</strong> CSS7 (0.010 m·s -1 * = p < 0.05<br />
; 0.8%) both <strong>in</strong>clud<strong>in</strong>g the 400-m trial <strong>in</strong> their calculation.<br />
Furthermore, the limits of agreement were very similar (CSS3: -6.1 to 5.1%; CSS7: -5.0<br />
to 6.6%). CSS10 overestimated V1500 by +3.5%.<br />
DISCUSSION<br />
The method used to calculate CSS (two-parameter model) has many advantages as a)<br />
Compar<strong>in</strong>g the proposed comb<strong>in</strong>ations used <strong>in</strong> this study with CSS 10 ,<br />
CSS 1 showed the highest difference (p = 0.0004) <strong>and</strong> worst level of<br />
agreement (-0.119 m·s -1 ; -8.9%). The lowest error on the estimation of<br />
CSS was observed from CSS 3 (-0.005 m·s -1 ; -0.5%) <strong>and</strong> CSS 7 (0.010<br />
m·s -1 ; 0.8%) both <strong>in</strong>clud<strong>in</strong>g the 400-m trial <strong>in</strong> their calculation. Furthermore,<br />
the limits of agreement were very similar (CSS 3: -6.1 to 5.1%;<br />
CSS 7 : -5.0 to 6.6%). CSS 10 overestimated V 1500 by +3.5%.<br />
dIscussIon<br />
The method used to calculate CSS (two-parameter model) has many advantages<br />
as a) ease of application, b) analysis of large numbers of athletes<br />
can be carried out dur<strong>in</strong>g tra<strong>in</strong><strong>in</strong>g sessions without the use of expensive<br />
equipment or blood collection, <strong>and</strong> c) easy to assess the evolution or that<br />
occurs with tra<strong>in</strong><strong>in</strong>g <strong>in</strong> a given period of time. This eases the test<strong>in</strong>g,<br />
especially for swimmer populations such as children <strong>and</strong> adolescents.<br />
Hav<strong>in</strong>g access to <strong>in</strong>formation of possible differences between CSS10 <strong>and</strong><br />
other comb<strong>in</strong>ations for predict<strong>in</strong>g CSS seems important when for some<br />
reason the coach needs to calculate the CSS with other distances.<br />
The first result of the present study was that the highest difference<br />
recorded <strong>in</strong> this study was that between CSS10 <strong>and</strong> CSS1 . However, a<br />
level of agreement is a more sensitive tool for test<strong>in</strong>g the accuracy of a<br />
method to predict a s<strong>in</strong>gle parameter. The substantial contribution of the<br />
anaerobic metabolism <strong>in</strong> the 50 <strong>and</strong> 100-m races (Gast<strong>in</strong>, 2001) could<br />
expla<strong>in</strong> this high difference between CSS10 <strong>and</strong> CSS1 (bias: -0.119 m·s- 1 ; -8.9%).<br />
The lowest error <strong>in</strong> the estimation of CSS10 was observed for CSS3 (-0.005 m·s-1 ; -0.5%) <strong>and</strong> CSS7 (0.010 m·s-1 ; 0.8%) both of them <strong>in</strong>clud<strong>in</strong>g<br />
the 400-m performance <strong>and</strong> one short distance (50 or 100-m) <strong>in</strong> the<br />
model<strong>in</strong>g. In addition, the limits of agreement were very similar (CSS3: -6.1 to 5.1%; CSS7 : -5.0 to 6.6%). Gast<strong>in</strong> (2001) used mathematical<br />
model<strong>in</strong>g techniques <strong>and</strong> suggested that performances lower than 75-s<br />
(under maximal <strong>in</strong>tensity) need more contribution of anaerobic than<br />
aerobic metabolism. However, there is a lower concentration of glycolytic<br />
enzymes <strong>and</strong> an <strong>in</strong>creased concentration of aerobic enzymes <strong>in</strong> adolescents<br />
compared with adults. Adolescents have a lower concentration<br />
of steroid hormones, which will <strong>in</strong>crease with the maturation process<br />
<strong>and</strong> therefore <strong>in</strong>crease muscle mass <strong>and</strong> anaerobic capacity (Dipla et al.,<br />
2009). Thus, probably the low anaerobic capacity of the swimmers is responsible<br />
for the similarity between CSS10 , CSS3 <strong>and</strong> CSS7 because the<br />
distances of 50 <strong>and</strong> 100-m do not seem to have <strong>in</strong>creased the value of<br />
CSS obta<strong>in</strong>ed by CSS3 <strong>and</strong> CSS7 . For females, it has been observed that<br />
muscle power reaches an earlier steady state, i.e soon after 14-15 years<br />
(Dipla et al., 2009). This might suggest studies to measure the level of<br />
agreement between CSS10 <strong>and</strong> the other comb<strong>in</strong>ations <strong>in</strong> young female<br />
<strong>and</strong> male swimmers (14-15 years), also to check whether this level of<br />
agreement will be ma<strong>in</strong>ta<strong>in</strong>ed until adulthood.<br />
Third, the results showed that the level of agreement between<br />
CSS10 <strong>and</strong> the comb<strong>in</strong>ations that use the distance of 800-m, 1500-m<br />
or both, can underestimate CSS10 <strong>in</strong> young swimmers. In our study,<br />
the underestimation of CSS10 was established between - 3.3 to 6.5%.<br />
The greater contribution of aerobic metabolism of the total energy required<br />
to travel distances of 800 <strong>and</strong> 1500-m (800-m: 643.55 ± 36.75<br />
s, 1500-m: 1230.91 ± 88.58 s) seems to have been the ma<strong>in</strong> reason for<br />
these f<strong>in</strong>d<strong>in</strong>gs (Gast<strong>in</strong>, 2001). In addition, although they are swimmers<br />
with a considerable level of experience, the application of extensive tests<br />
(800 <strong>and</strong> 1500-m) <strong>in</strong> young swimmers <strong>in</strong> the swimm<strong>in</strong>g tra<strong>in</strong><strong>in</strong>g situation<br />
rather than a competitive situation may dim<strong>in</strong>ish their motivation<br />
which would affect the performance of the test. Moreover, as they are<br />
spr<strong>in</strong>t swimmers, some of them probably did not have sufficient experience<br />
with longer events.<br />
F<strong>in</strong>ally, CSS10 (200-400m) was higher than V1500 (+3.5%) with performances<br />
over this distance rang<strong>in</strong>g from 19.5 to 22-m<strong>in</strong> (1231 ± 88 s)<br />
<strong>in</strong> young swimmers. This difference was similar to that found bewteen<br />
CSS10 <strong>and</strong> the speed of 30-m<strong>in</strong> test by Dekerle et al. (2002), which<br />
suggested a correction of - 3.2% to establish the swimm<strong>in</strong>g velocity over


